Benchmarking GPU sharing strategies in Kubernetes
This writeup is the conclusion of my previous post. If you don’t know what MIG, MPS and Time Slicing do, I’d suggest reading that one first.
Before talking about the results, there’s one thing worth calling out in the Pytorch notes on CUDA:
By default, GPU operations are asynchronous. When you call a function that uses the GPU, the operations are enqueued to the particular device, but not necessarily executed until later. This allows us to execute more computations in parallel, including operations on CPU or other GPUs.
A consequence of the asynchronous computation is that time measurements without synchronizations are not accurate. To get precise measurements, one should either call torch.cuda.synchronize() before measuring, or use torch.cuda.Event to record times as following:
However, this is not a concern for these benchmarks due to the following reasons:
- after testing this with and without
torch.cuda.synchronize()calls, there was no difference in the timings. - Where appropriate, pytorch would internally call synchronize as it would have to in order to return the result of a gpu calculation to the CPU. You can see this in the logs when you call
torch.cuda.set_sync_debug_mode(debug_mode="warn")
To get the results I used the following configuration:
- Nvidia A100.
- Replica count of 7 pods for each strategy. I chose 7 as that is the maximum number of replicas that can be set with MIG.
- I setup a prometheus instance to scrape the metrics. Setting that up is out of scope, so go read the prometheus docs if you don’t know how to do that.
- I used a prometheus histogram so that I could observe latencies via buckets and count the overall number of observations made.
- Each benchmark was ran for several minutes to allow the GPU to warm up.
Results
Latencies
Matrix Multiplication
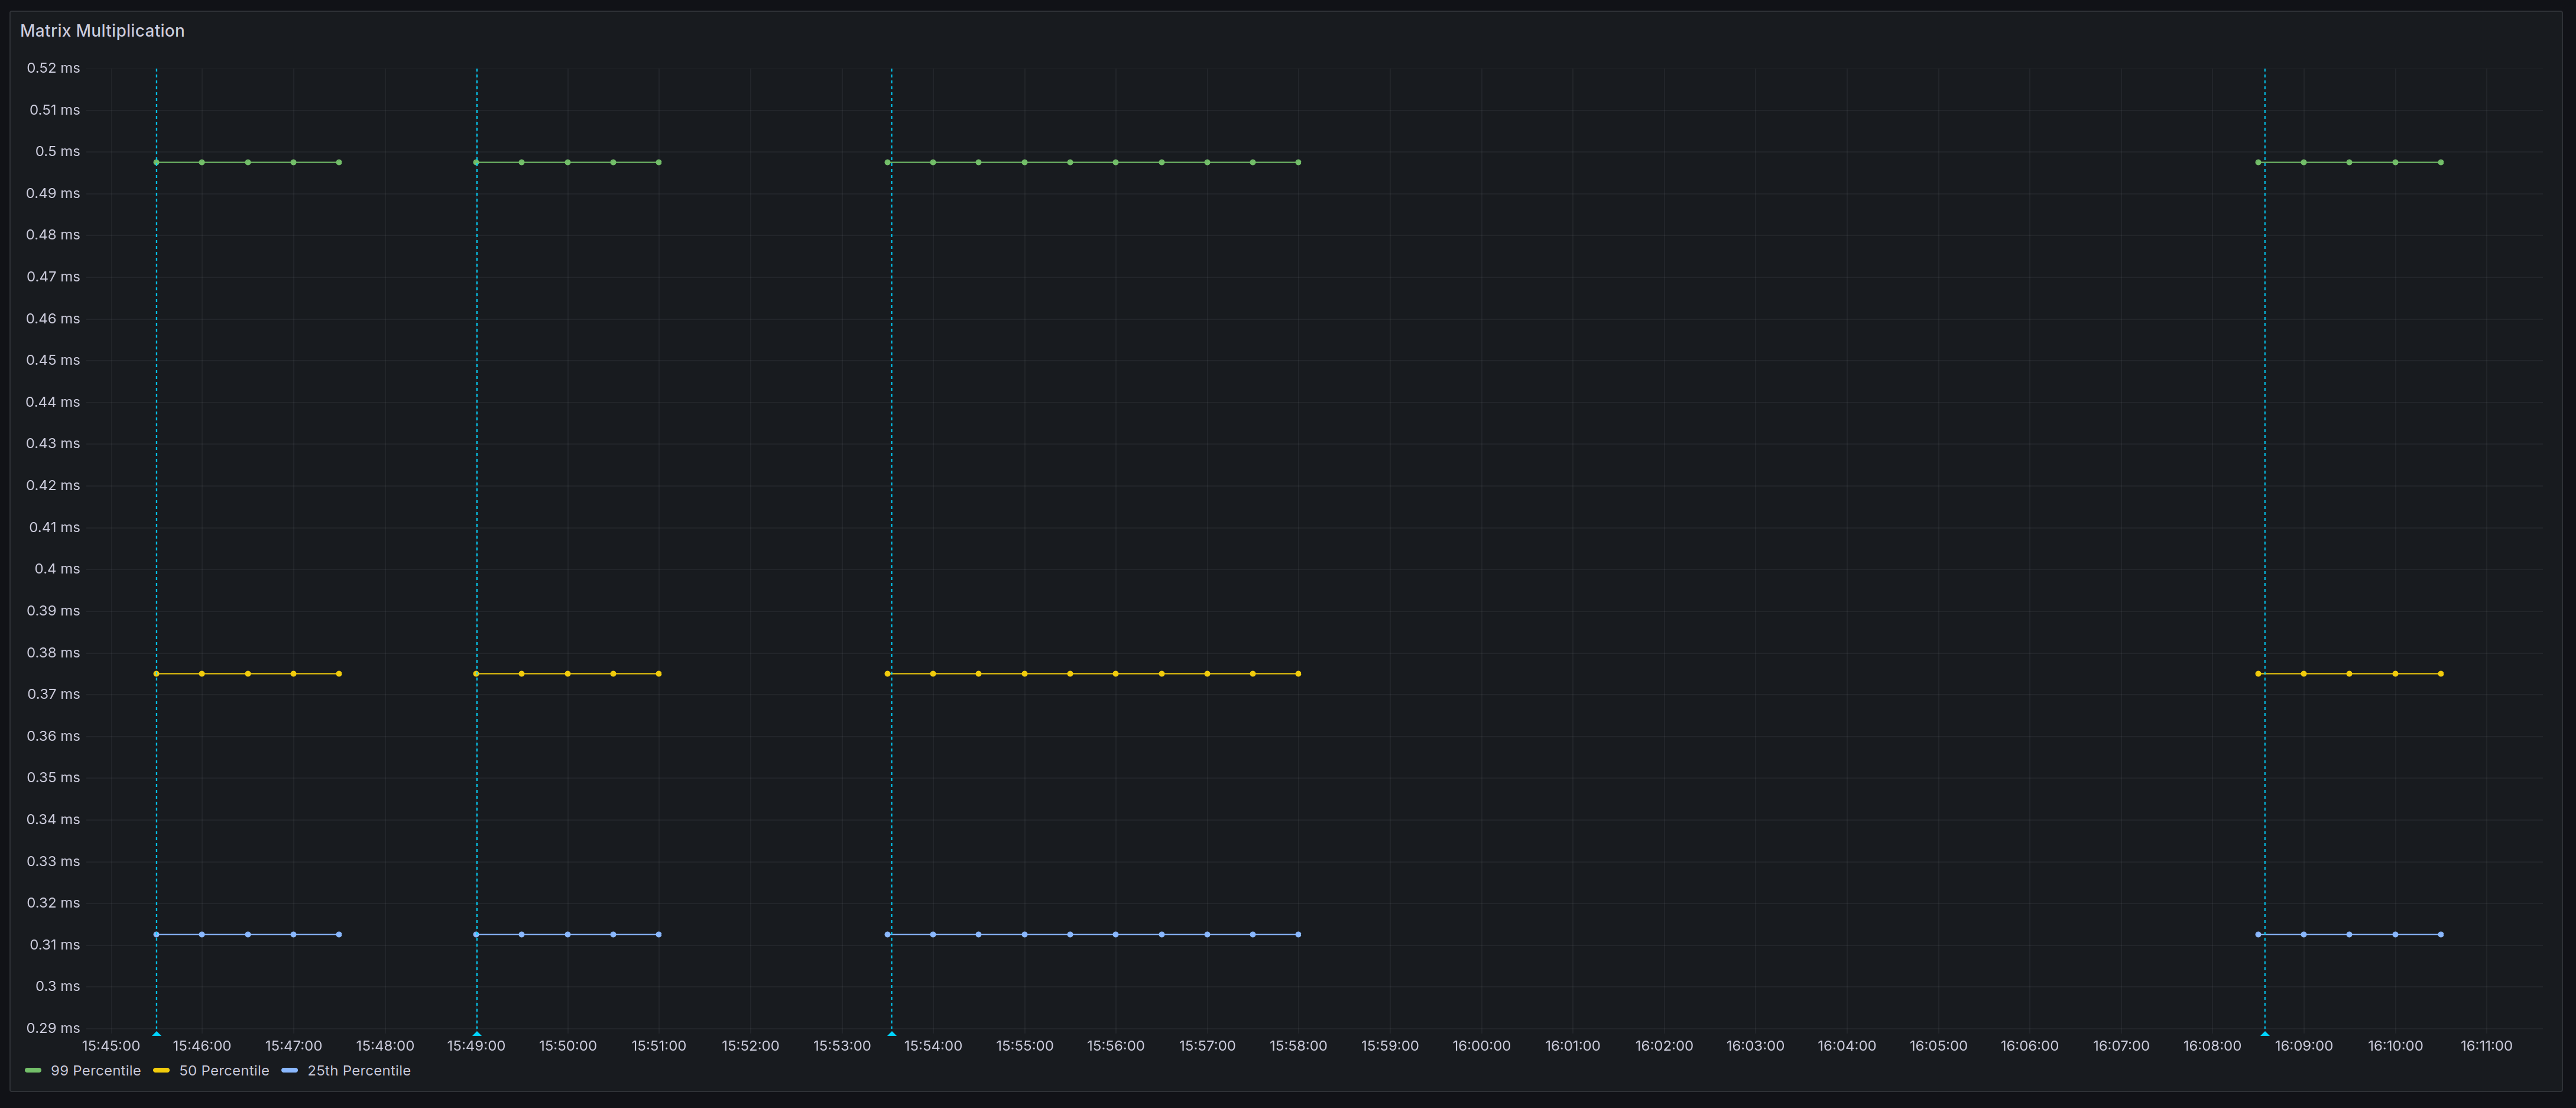
Here I just multiply two enormous square matrices together and return the result.
import torch
import time
from prometheus_client import start_http_server, Histogram

# Check if CUDA is available and Tensor Cores are supported
if not torch.cuda.is_available():
    raise SystemError("CUDA is not available on this system")

device = torch.device("cuda")

torch.cuda.set_sync_debug_mode(debug_mode="warn")

torch.set_default_device(device) # ensure we actually use the GPU and don't do the calculations on the CPU

h = Histogram('gpu_stress_mat_mul_seconds_duration', 'Description of histogram', buckets=(0.001, 0.005, 0.01, 0.1, 0.25, 0.5, 1.0, 2.0, 3.0, 4.0, 5.0, 10.0, 20.0, 50.0, 100.0, 200.0, 500.0, 1000.0))

# Function to perform matrix multiplication using Tensor Cores
def stress(matrix_size=16384):
    # Create random matrices on the GPU
    m1 = torch.randn(matrix_size, matrix_size, dtype=torch.float16)
    m2 = torch.randn(matrix_size, matrix_size, dtype=torch.float16)

    # Perform matrix multiplications indefinitely
    while True:
        start = time.time()
        output = torch.matmul(m1, m2)
        print(output.any())
        end = time.time()
        h.observe(end - start)

if __name__ == "__main__":
    start_http_server(8000)
    stress()

It doesn’t matter which line is which in the graph as there was zero difference.
Inference
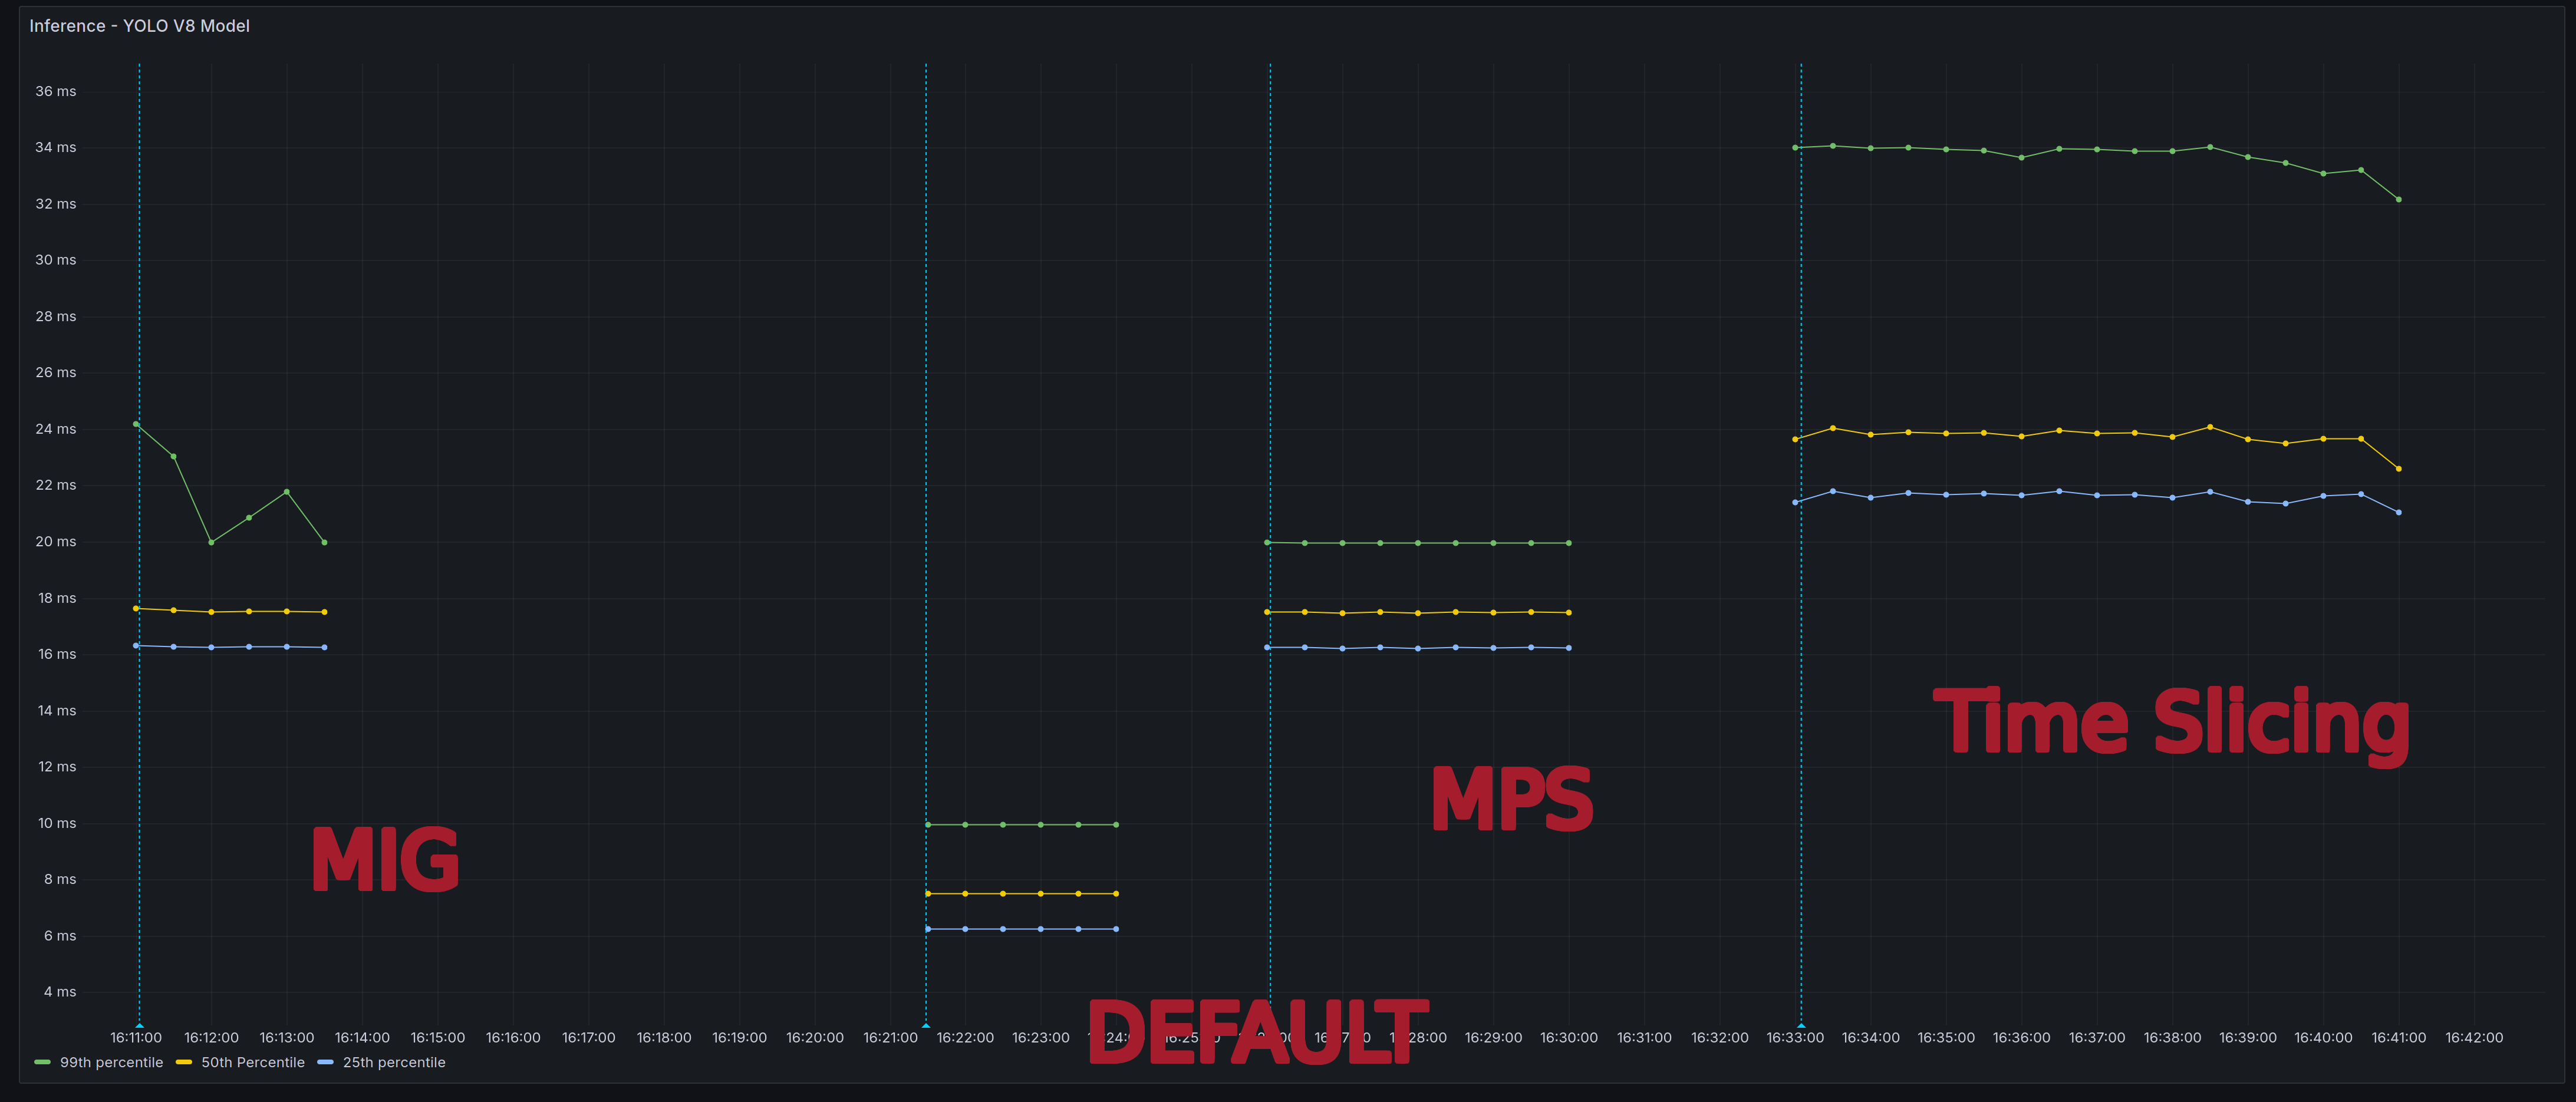
So the matrix multiplication on its own was far too contrived of a test case. Therefore, my next benchmark used an object detection model. I chose the ultralytics YOLOv8 model to do this. I decided to use YOLO to see if I could get a similar set of results to this YOLO benchmark.
import os

# Set YOLOv8 to quiet mode
os.environ['YOLO_VERBOSE'] = 'False'

from prometheus_client import start_http_server, Histogram
from ultralytics import YOLO
import torch

start_http_server(8000)

device = torch.device("cuda")

model = YOLO("yolov8n.pt").to(device=device)

h = Histogram('gpu_stress_inference_yolov8_milliseconds_duration', 'Description of histogram', buckets=(1, 5, 10, 15, 20, 25, 30, 35, 40, 50, 75, 100, 150, 200, 500, 1000, 5000))

def run_model():
    results = model("https://ultralytics.com/images/bus.jpg")
    # print(model.device.type)
    h.observe(results[0].speed['inference'])

while True:
    run_model()

Whilst I was able to replicate their conclusion i.e MPS is the best sharing strategy out of the three, they did not actually benchmark MPS against the default strategy. When I did that, it showed a very interesting set of results. The Yolo model performed best with the default settings! I also tried this again with a Bert model and randomising the input tokens, but I was getting the same trend in the results.
Latency vs. Throughput
As I was initially a bit confused by the stats, I posted on stackoverflow to help clarify these results. I managed to get a very detailed answer back from someone that worked at Nvidia! Their response was that the outcome will vary depending on whether you are optimising for latency or throughput. Let’s define what I mean by this:
Latency is about speed. It’s the time it takes to complete a single task or operation. A lower latency means a faster response time for individual tasks. This is useful for real-time scenarios e.g. a chatbot.
Throughput, on the other hand, is about volume. It refers to the number of tasks or operations that can be completed in a given period of time. Higher throughput is going to be more important for workloads that require processing large volumes of data or running multiple applications concurrently.
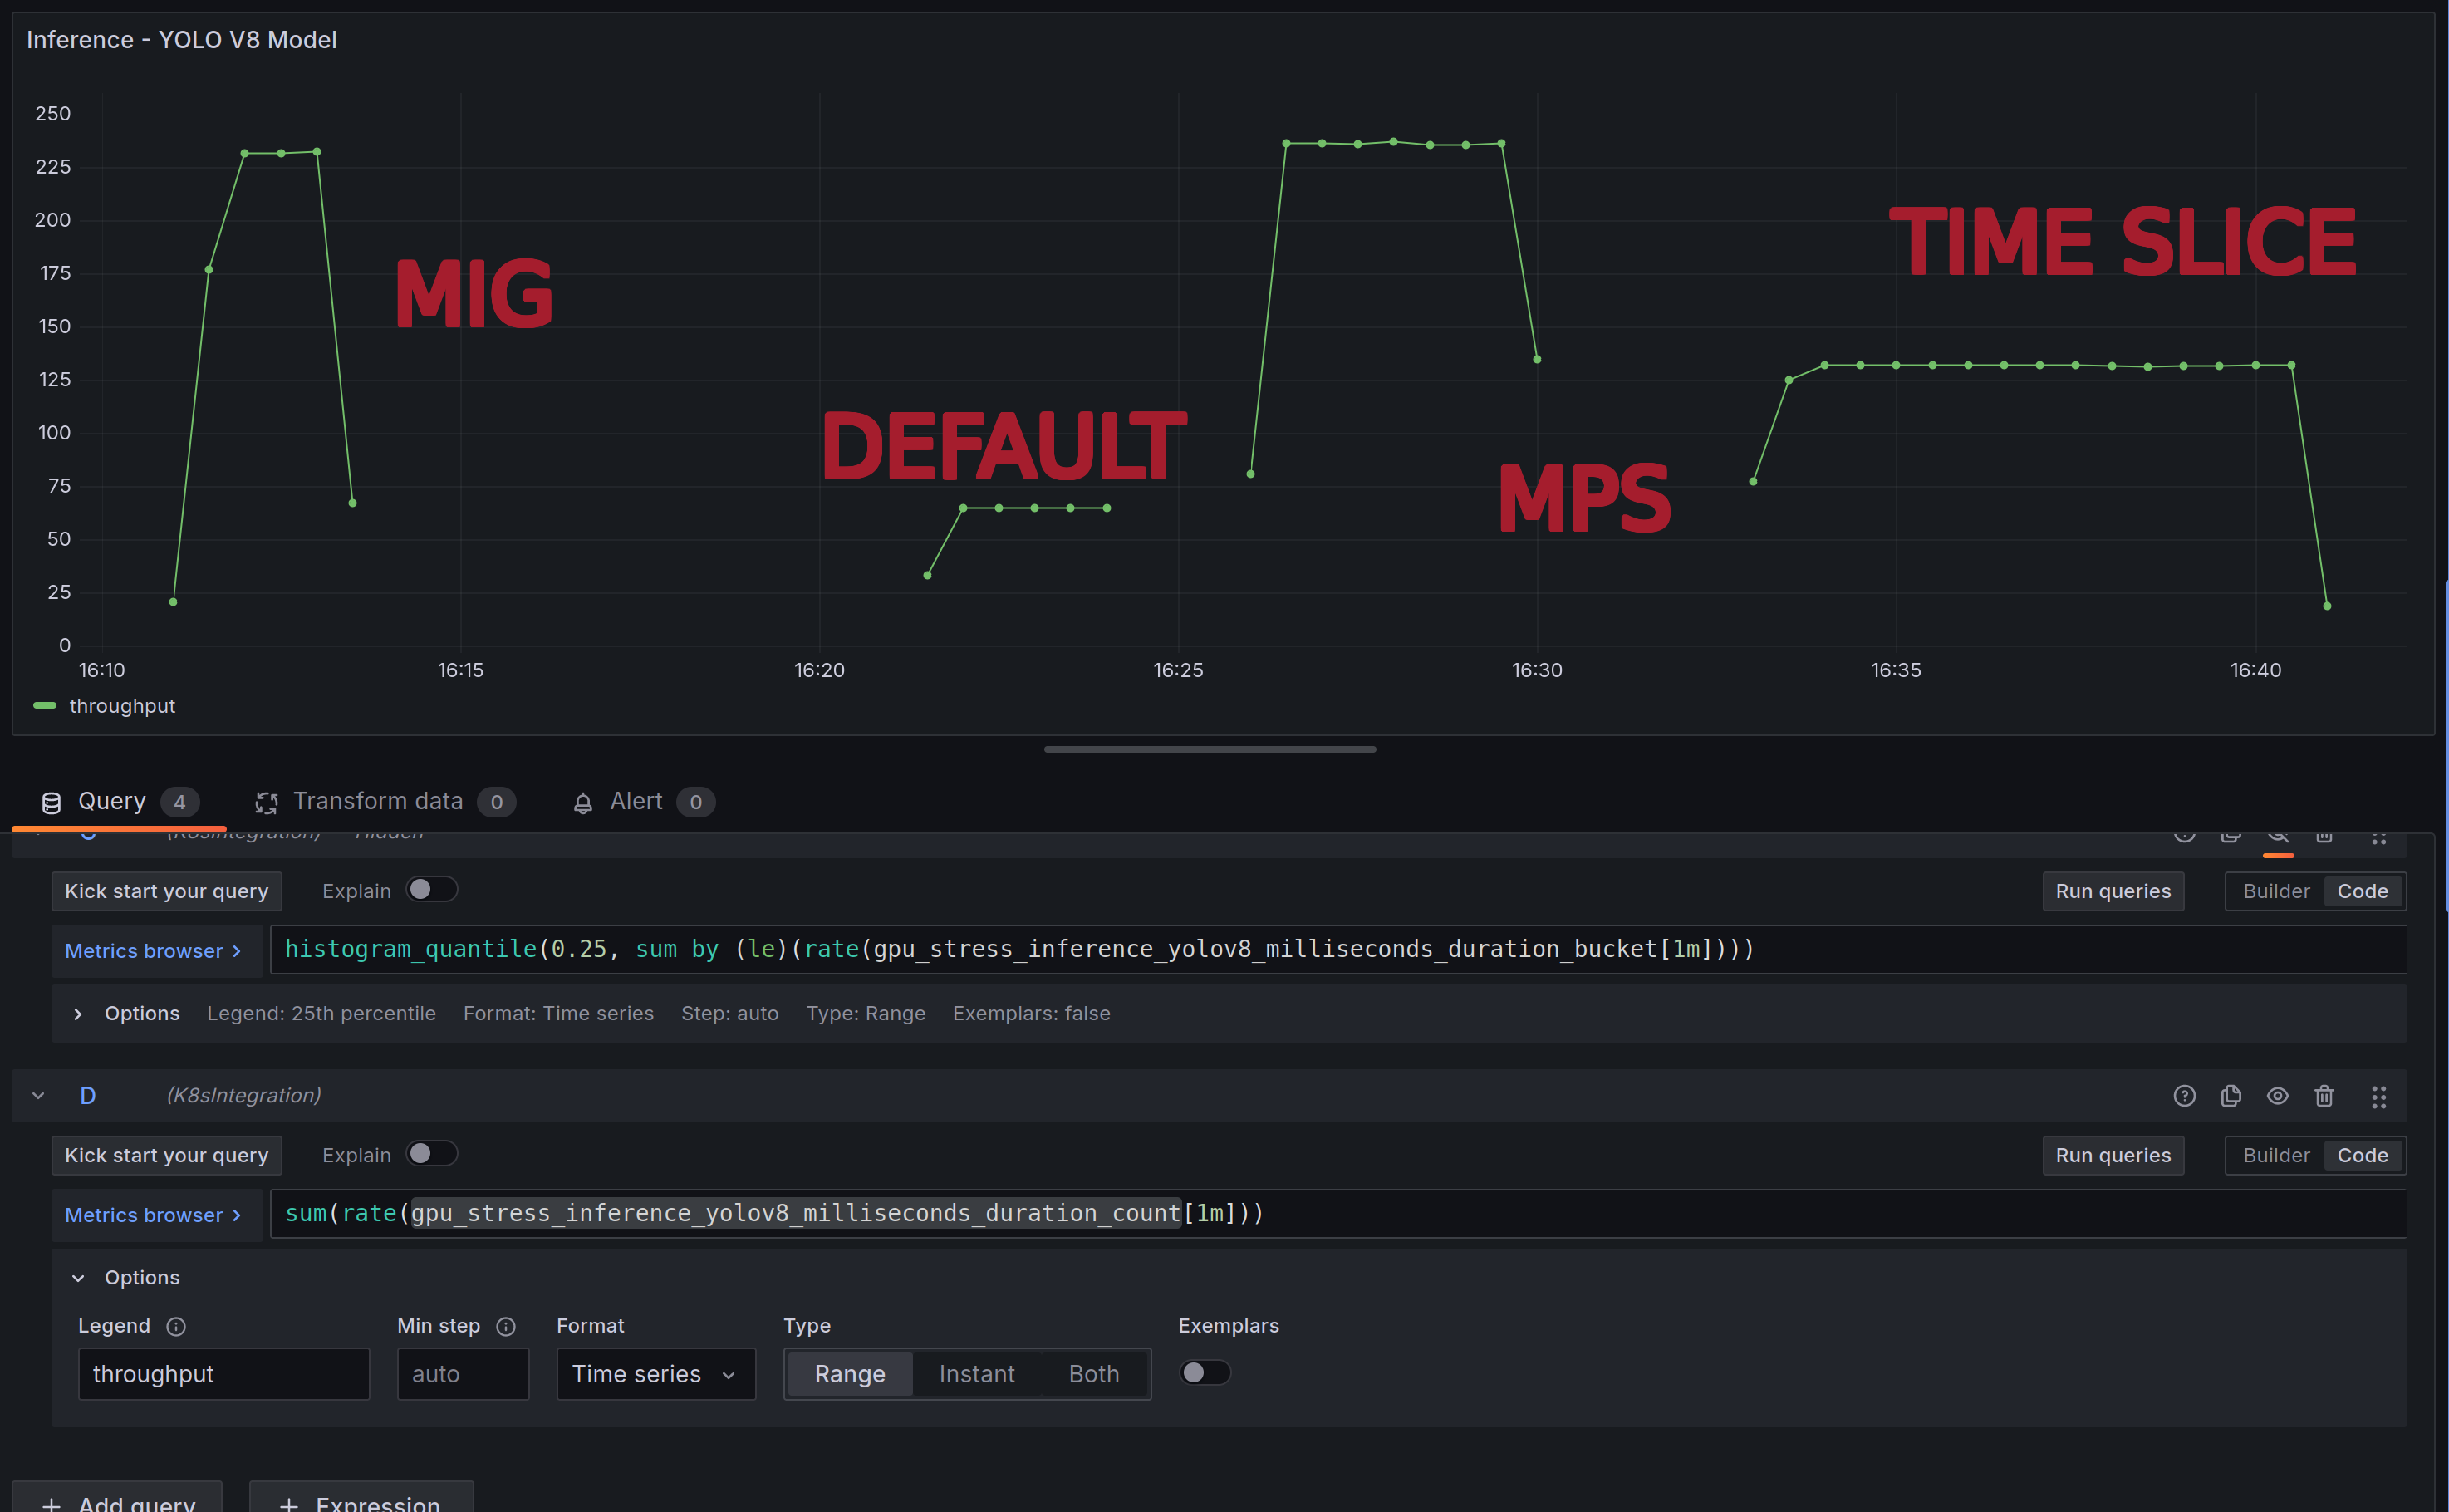
Let’s go back to the yolo v8 inference benchmark. Yes, it’s about 2x slower per second from a latency point of view, but if we look at throughput a different picture emerges. We get ~4x the throughput per second with MPS vs. the default settings:

Conclusion
How you choose to configure your GPU sharing settings ultimately comes down to the type of workload that you’re doing and what you’re looking to optimise for:
- If it’s latency, then you should use the default settings. Each application will get access to the entire GPU, do its work, and once finished, the GPU will be provided to the next application that was requesting compute. Therefore, as we are not breaking a GPU up into 7 figurative pieces, it stands to reason that will be the option that provides the lowest latency.
- If you want concurrency and throughput at the expense of latency - use MPS. A good use case is data pipelines that leverage machine learning.
- If fault tolerance/isolation/quality of service are critical, then you could use MIG.