Understanding GPU sharing strategies in Kubernetes
[UPDATE]
I’ve now posted my benchmarks, so if you just need to see those stats then have a read of benchmarking-gpu-sharing-strategies-in-kubernetes.
These notes are aimed at anyone that wants to setup Nvidia GPU sharing strategies within k8s without having to trawl through a lot of crypic and dense Nvidia documentation. I’m also focusing on a high level ELI5, using the knowledge I’ve gained so far on the subject, of:
- MIG (Multi-Instance GPUs)
- MPS (Multi-process service)
- Time Slicing
I used two Nvidia cards to put these notes together:
- A100
- LS40
There’s still gaps in my understanding of how these strategies work and when to employ them, but this should get people to a point where they can start tinkering with them.
Initial Setup
I’ll assume nvidia’s device plugin for k8s has been installed. If not, go do that first. I used helm chart version 0.15 for putting together these notes. Also, make sure you have the following setup on your worker node:
- NVIDIA drivers ~= 384.81 (I used 550.54.14-1)
- nvidia-docker >= 2.0 || nvidia-container-toolkit >= 1.7.0 (>= 1.11.0 to use integrated GPUs on Tegra-based systems)
- nvidia-container-runtime configured as the default low-level runtime
- Kubernetes version >= 1.10
Test Deployment
To test each strategy, we have a dummy deployment for inducing some sort of load on the GPU. The python code doesn’t really matter here, you can use anything so long as it taxes the GPU’s framebuffer and/or stream multi-processors (SMs).
# stress.py
import torch
import torch.nn as nn
import torch.optim as optim
from torchvision import models

# Set device to GPU if available
device = torch.device("cuda" if torch.cuda.is_available() else "cpu")

# Define a simple model
class SimpleModel(nn.Module):
    def __init__(self):
        super(SimpleModel, self).__init__()
        self.conv1 = nn.Conv2d(3, 64, kernel_size=3, stride=1, padding=1)
        self.conv2 = nn.Conv2d(64, 128, kernel_size=3, stride=1, padding=1)
        self.conv3 = nn.Conv2d(128, 256, kernel_size=3, stride=1, padding=1)
        self.fc1 = nn.Linear(256 * 16 * 16, 1024)
        self.fc2 = nn.Linear(1024, 10)
        self.relu = nn.ReLU()
        self.maxpool = nn.MaxPool2d(kernel_size=2, stride=2)

    def forward(self, x):
        x = self.relu(self.conv1(x))
        x = self.maxpool(x)
        x = self.relu(self.conv2(x))
        x = self.maxpool(x)
        x = self.relu(self.conv3(x))
        x = self.maxpool(x)
        x = x.view(x.size(0), -1)
        x = self.relu(self.fc1(x))
        x = self.fc2(x)
        return x

model = SimpleModel().to(device)

# Create random input data
input_data = torch.randn(64, 3, 128, 128).to(device)

# Define a loss function and optimizer
criterion = nn.CrossEntropyLoss()
optimizer = optim.Adam(model.parameters(), lr=0.001)

# Run an infinite loop to stress the GPU
while True:
    optimizer.zero_grad()
    output = model(input_data)
    target = torch.randint(0, 10, (64,)).to(device)  # Random target
    loss = criterion(output, target)
    loss.backward()
    optimizer.step()
    print(f"Loss: {loss.item()}")
And an accompanying Dockerfile:
FROM pytorch/pytorch:latest

WORKDIR /app

RUN pip install torchvision

COPY stress.py stress.py

CMD ["python", "stress.py"]
With a deployment manifest to run our cuda application:
apiVersion: apps/v1
kind: Deployment
metadata:
    name: gpu-stress-deployment
spec:
    strategy:
        type: Recreate
    replicas: 1
    selector:
        matchLabels:
            app: gpu-stress
    template:
        metadata:
            labels:
                app: gpu-stress
        spec:
            nodeName: <gpu_worker_node>
            containers:
                - name: gpu-stress-test
                  image: <gpu_stress_image>
                  imagePullPolicy: Always
                  resources:
                      limits:
                          nvidia.com/gpu: 1
Compute Modes
Before deliving into each strategy, we need to touch on Nvidia’s system management interface, nvidia-smi.
Specifically we need to talk about a certain flag named compute-mode as it will become relevant later in this post. I’ve quoted their cli docs to explain what it means:
The compute mode flag indicates whether individual or multiple compute applications may run on the GPU.
“Default” means multiple contexts are allowed per device.
“Exclusive Process” means only one context is allowed per device, usable from multiple threads at a time.
“Prohibited” means no contexts are allowed per device (no compute apps).
As we’ll see later, the compute mode will change depending on the GPU strategy.
Vanilla Configuration
I don’t know exactly what to call this. It’s just using nvidia’s default compute mode. This means that you can have as many CUDA contexts i.e. applications as you want talking to one GPU.
Secondly, I struggled to find any documentation on how this mode actually works under the hood. I did come across this stackoverflow post that says the following, but I’m unsure if it still applies in 2024:
CUDA activity from independent host processes will normally create independent CUDA contexts, one for each process. Thus, the CUDA activity launched from separate host processes will take place in separate CUDA contexts, on the same device.
CUDA activity in separate contexts will be serialized. The GPU will execute the activity from one process, and when that activity is idle, it can and will context-switch to another context to > complete the CUDA activity launched from the other process.
With nvidia’s device plugin installed, we can get a pod to request a GPU by applying the following to its manifest:
resources:
    limits:
        nvidia.com/gpu: 1
However, this is unusable in concurrent setups that have one GPU per worker node because any other pod that requests a GPU will not be able to run due to the following sort of error:
Message:          Pod was rejected: Allocate failed due to requested number of devices unavailable for nvidia.com/gpu. Requested: 1, Available: 0, which is unexpected
...

Events:
Type Reason Age From Message

---

Warning UnexpectedAdmissionError 11s kubelet Allocate failed due to requested number of devices unavailable for nvidia.com/gpu. Requested: 1, Available: 0, which is unexpected
To fix this, we can actually just remove the resources option i.e. specify no limits or requests. We now get replicas:
apiVersion: apps/v1
kind: Deployment
metadata:
    name: gpu-stress-deployment
spec:
    strategy:
        type: Recreate
    replicas: 2
    selector:
        matchLabels:
            app: gpu-stress
    template:
        metadata:
            labels:
                app: gpu-stress
        spec:
            nodeName: <gpu_worker_node>
            containers:
                - name: gpu-stress-test
                  image: <gpu_stress_image>
                  imagePullPolicy: Always

By exec’ing into each pod, you can see from cuda’s point of view, each pod thinks it has access to all GPU hardware:
import torch
torch.cuda.get_device_properties(torch.device("cuda"))
# _CudaDeviceProperties(name='NVIDIA L40S', major=8, minor=9, total_memory=45589MB, multi_processor_count=142)
However, whilst this allows us to have multiple applications talk to the GPU, it has a drawback. If there’s no more VRAM any new i.e. recently starting applications talking to the GPU will fail. In other words the last applications to start talking to the GPU will be the first ones to crash:
apiVersion: apps/v1
kind: Deployment
metadata:
    name: gpu-stress-deployment
spec:
    strategy:
        type: Recreate
    replicas: 20 # too many replicas, too much VRAM nom nom
    selector:
        matchLabels:
            app: gpu-stress
    template:
        metadata:
            labels:
                app: gpu-stress
        spec:
            nodeName: <gpu_worker_node>
            containers:
                - name: gpu-stress-test
                  image: <gpu_stress_image>
                  imagePullPolicy: Always
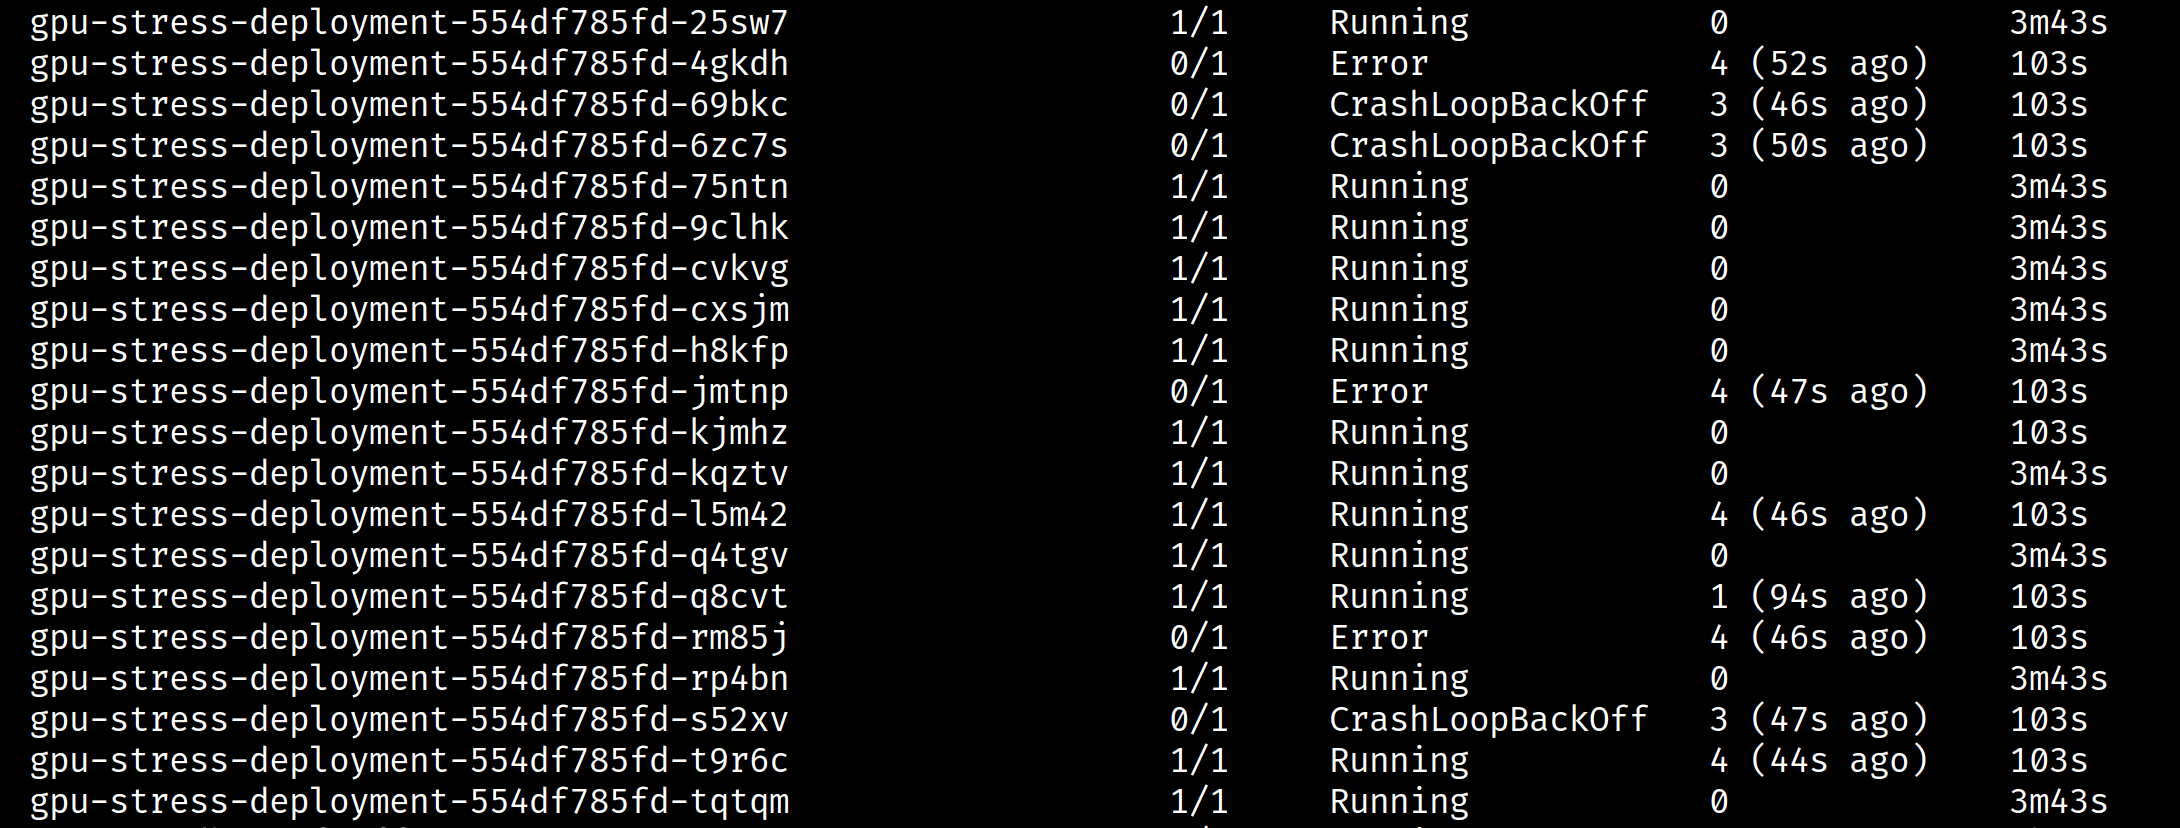
You’ll see this sort of error with pytorch:
RuntimeError: CUDA error: out of memory
CUDA kernel errors might be asynchronously reported at some other API call, so the stacktrace below might be incorrect.
For debugging consider passing CUDA_LAUNCH_BLOCKING=1.
Compile with `TORCH_USE_CUDA_DSA` to enable device-side assertions.
This means that we can’t avoid applications monopolising a GPU. More on this later.
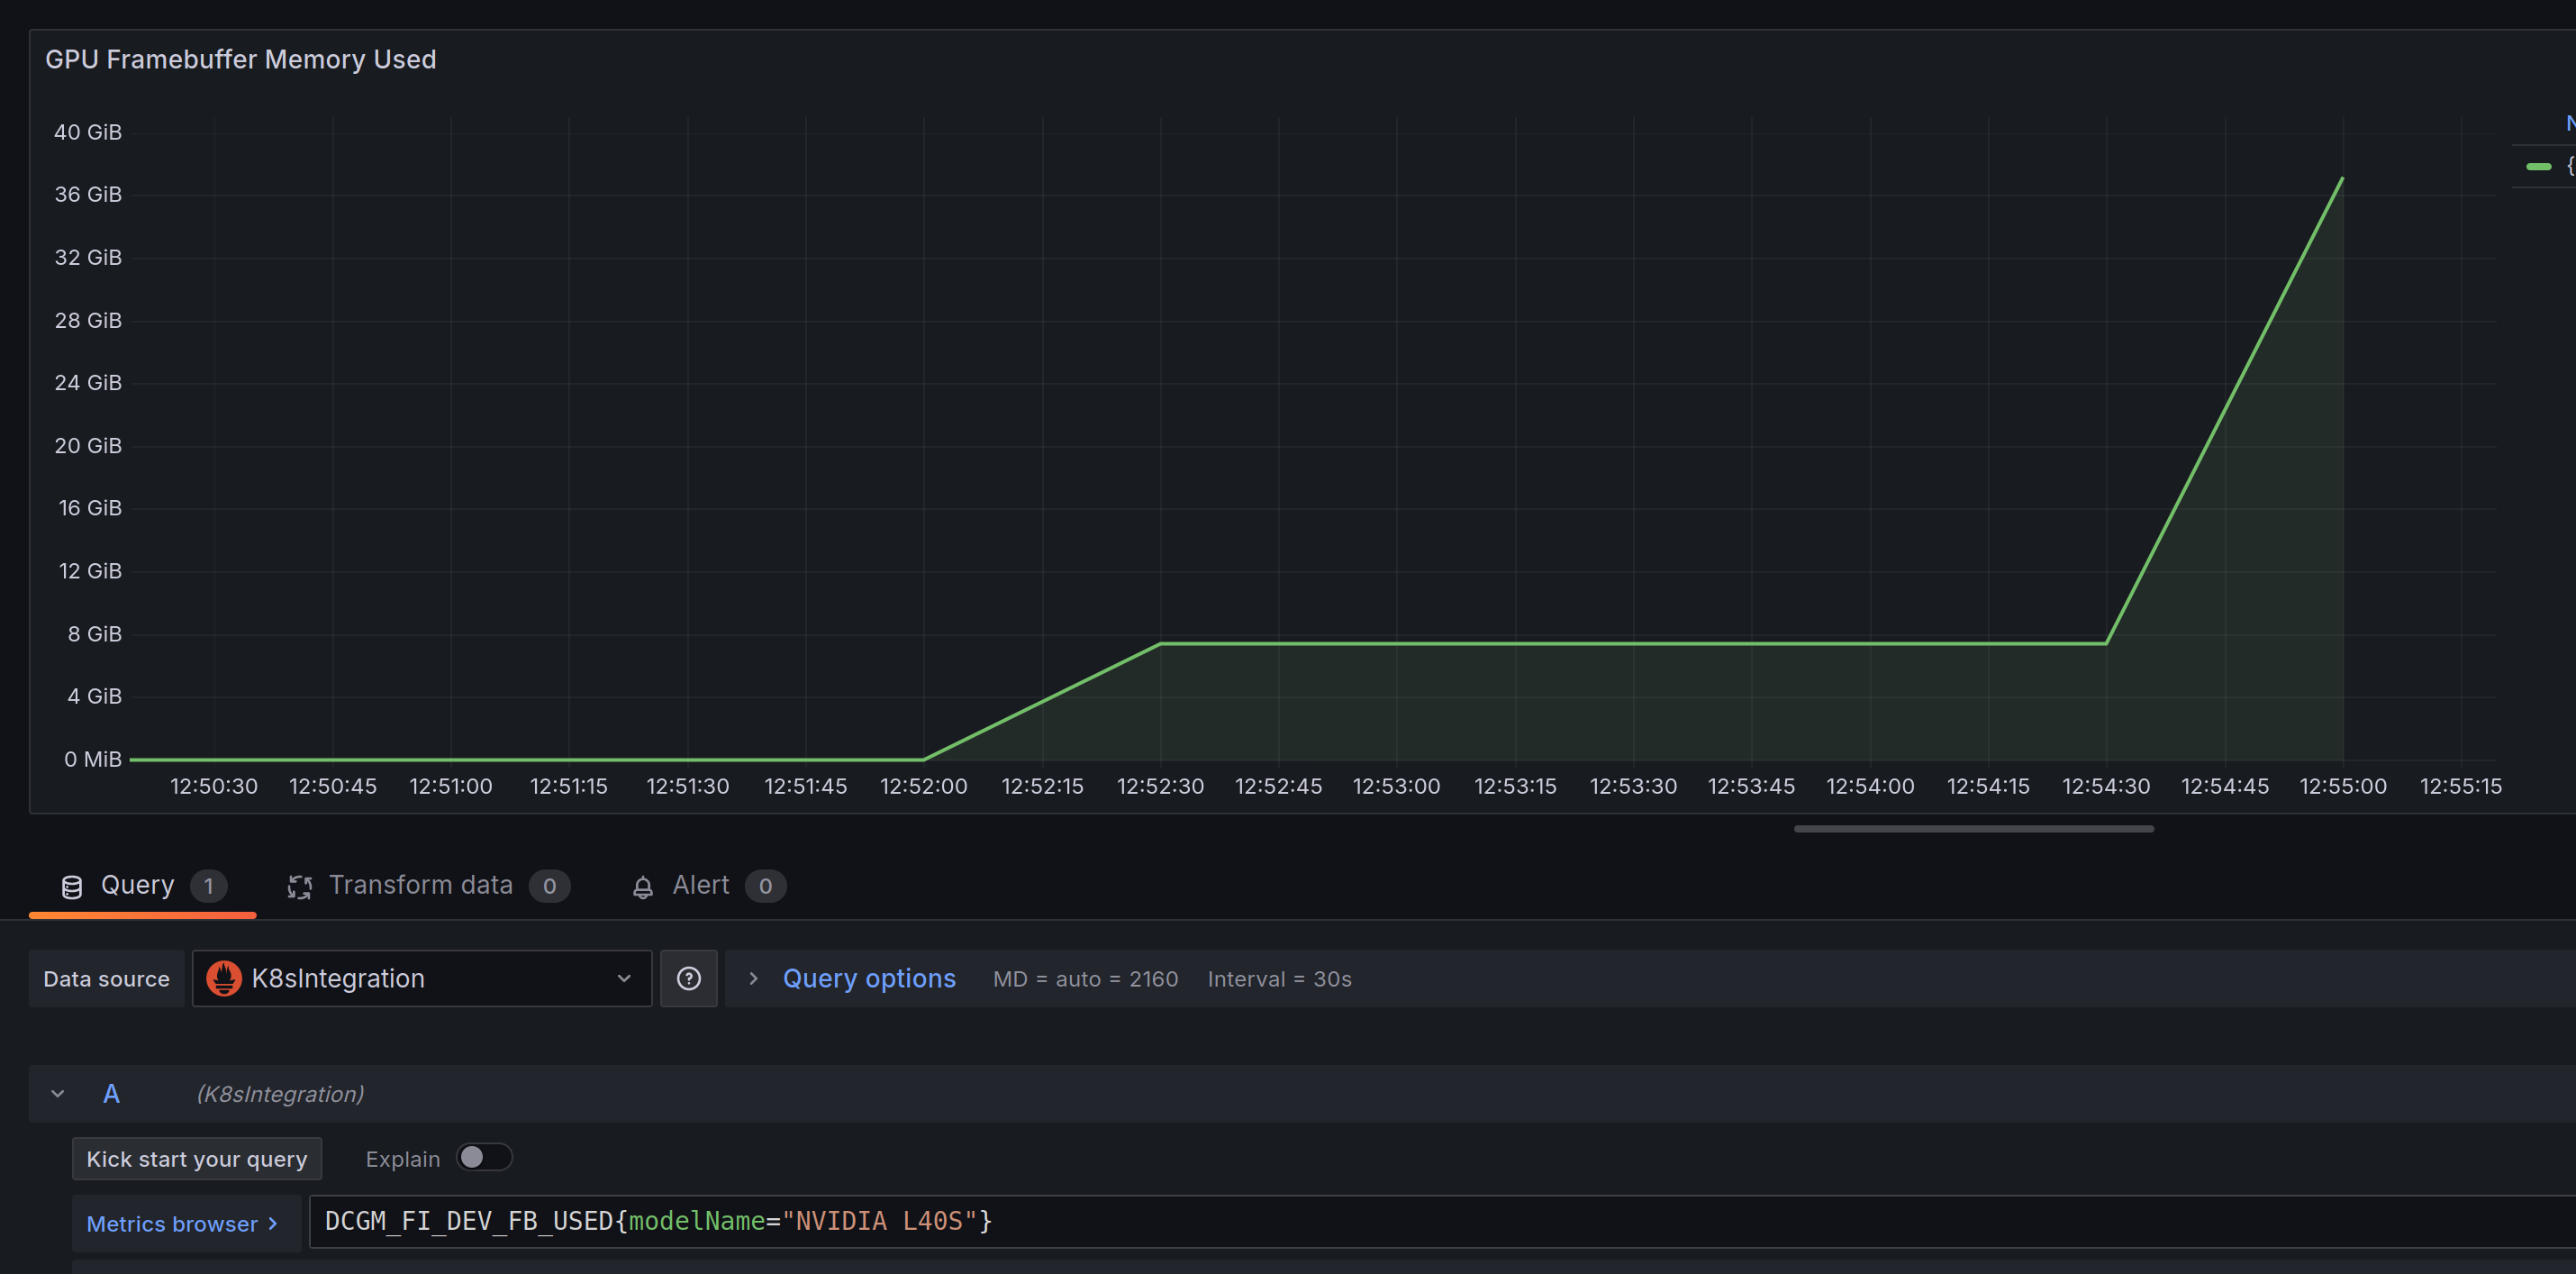
On another note, for some reason Nvidia’s DCGM exporter doesn’t report metrics per pod. I’ve not yet dug into why this is:
Strategies
Time Slicing
Have a read of this to understand what time slicing does. Essentially, in order to carry out tasks seemingly simultaneously, we allocate a slice of time per process to do its work. The processes in this context will be k8s pods. To quote their docs:
This mechanism for enabling time-slicing of GPUs in Kubernetes enables a system administrator to define a set of replicas for a GPU, each of which can be handed out independently to a pod to run workloads on.
It’s worth noting that time slicing is also a form of context switching. Furthermore, their docs mention that you can do something called GPU oversubscription with this technique. To be honest, I actually don’t understand how oversubscription works and why you’d use it, something about unified virtual memory. Maybe one for another post.
To start using this, we need to provide the nvidia-device-plugin helm chart with a config file. It’s stored as a config map (CM) in k8s. You can supply this CM via the chart’s values.yaml. Here’s what it would look like for an ls40:
config:
    # This looks weird, but you have to have a default config map,
    # which we make empty, otherwise the nvidia device plugin helm
    # chart explodes when installed
    default: 'default'
    map:
        default: |- # blank CM
        ls40: |-
            version: v1
            sharing:
              timeSlicing:
                renameByDefault: false
                failRequestsGreaterThanOne: true
                resources:
                  - name: nvidia.com/gpu
                    replicas: 10
For this writeup, I used one GPU per worker node. Therefore this CM will advertise 10 GPU resources being available to k8s on a given GPU worker node. Similarly, if we had 10 GPUs per worker node, then we’d have 100 replicas available to use i.e. 10 * 10 = 100
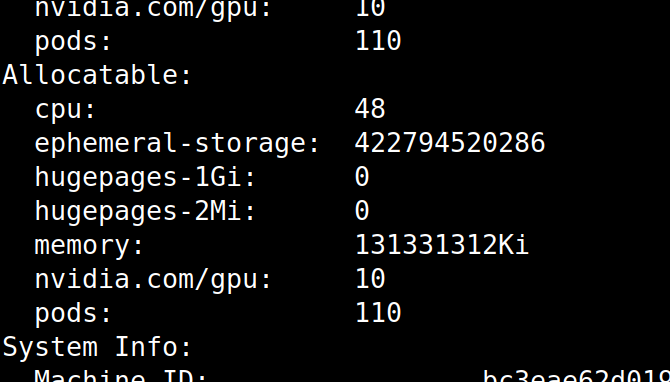
As per nvidia’s docs:
In both cases, the plugin simply creates 10 references to each GPU and indiscriminately hands them out to anyone that asks for them.
Therefore, if we update our manifest to use this:
apiVersion: apps/v1
kind: Deployment
metadata:
    name: gpu-stress-deployment
spec:
    strategy:
        type: Recreate
    replicas: 5
    selector:
        matchLabels:
            app: gpu-stress
    template:
        metadata:
            labels:
                app: gpu-stress
        spec:
            nodeName: <gpu_worker_node>
            containers:
                - name: gpu-stress-test
                  image: <gpu_stress_image>
                  imagePullPolicy: Always
                  resources:
                      limits:
                          nvidia.com/gpu: 1 # slice per pod
5 “GPUS” i.e. slices are in use:
Allocated resources:
  (Total limits may be over 100 percent, i.e., overcommitted.)
  Resource           Requests    Limits
  --------           --------    ------
  cpu                155m (0%)   100m (0%)
  memory             115Mi (0%)  750Mi (0%)
  ephemeral-storage  0 (0%)      0 (0%)
  hugepages-1Gi      0 (0%)      0 (0%)
  hugepages-2Mi      0 (0%)      0 (0%)
  nvidia.com/gpu     5           5
Notice that the hardware isn’t divided up. An Nvidia LS40 card has 142 SMs and 46GB of VRAM. Exec into a running gpu-stress-deployment pod and run the following:
import torch
torch.cuda.get_device_properties(torch.device("cuda"))
# _CudaDeviceProperties(name='NVIDIA L40S', major=8, minor=9, total_memory=45589MB, multi_processor_count=142)
What happens if we set our deployment to use 11 GPUs? Well, k8s will fail to setup the 11th replica and then continously reattempt to provision it
apiVersion: apps/v1
kind: Deployment
metadata:
    name: gpu-stress-deployment
spec:
    strategy:
        type: Recreate
    replicas: 11
    selector:
        matchLabels:
            app: gpu-stress
    template:
        metadata:
            labels:
                app: gpu-stress
        spec:
            nodeName: <gpu_worker_node>
            containers:
                - name: gpu-stress-test
                  image: <gpu_stress_image>
                  imagePullPolicy: Always
                  resources:
                      limits:
                          nvidia.com/gpu: 1 # slice per pod
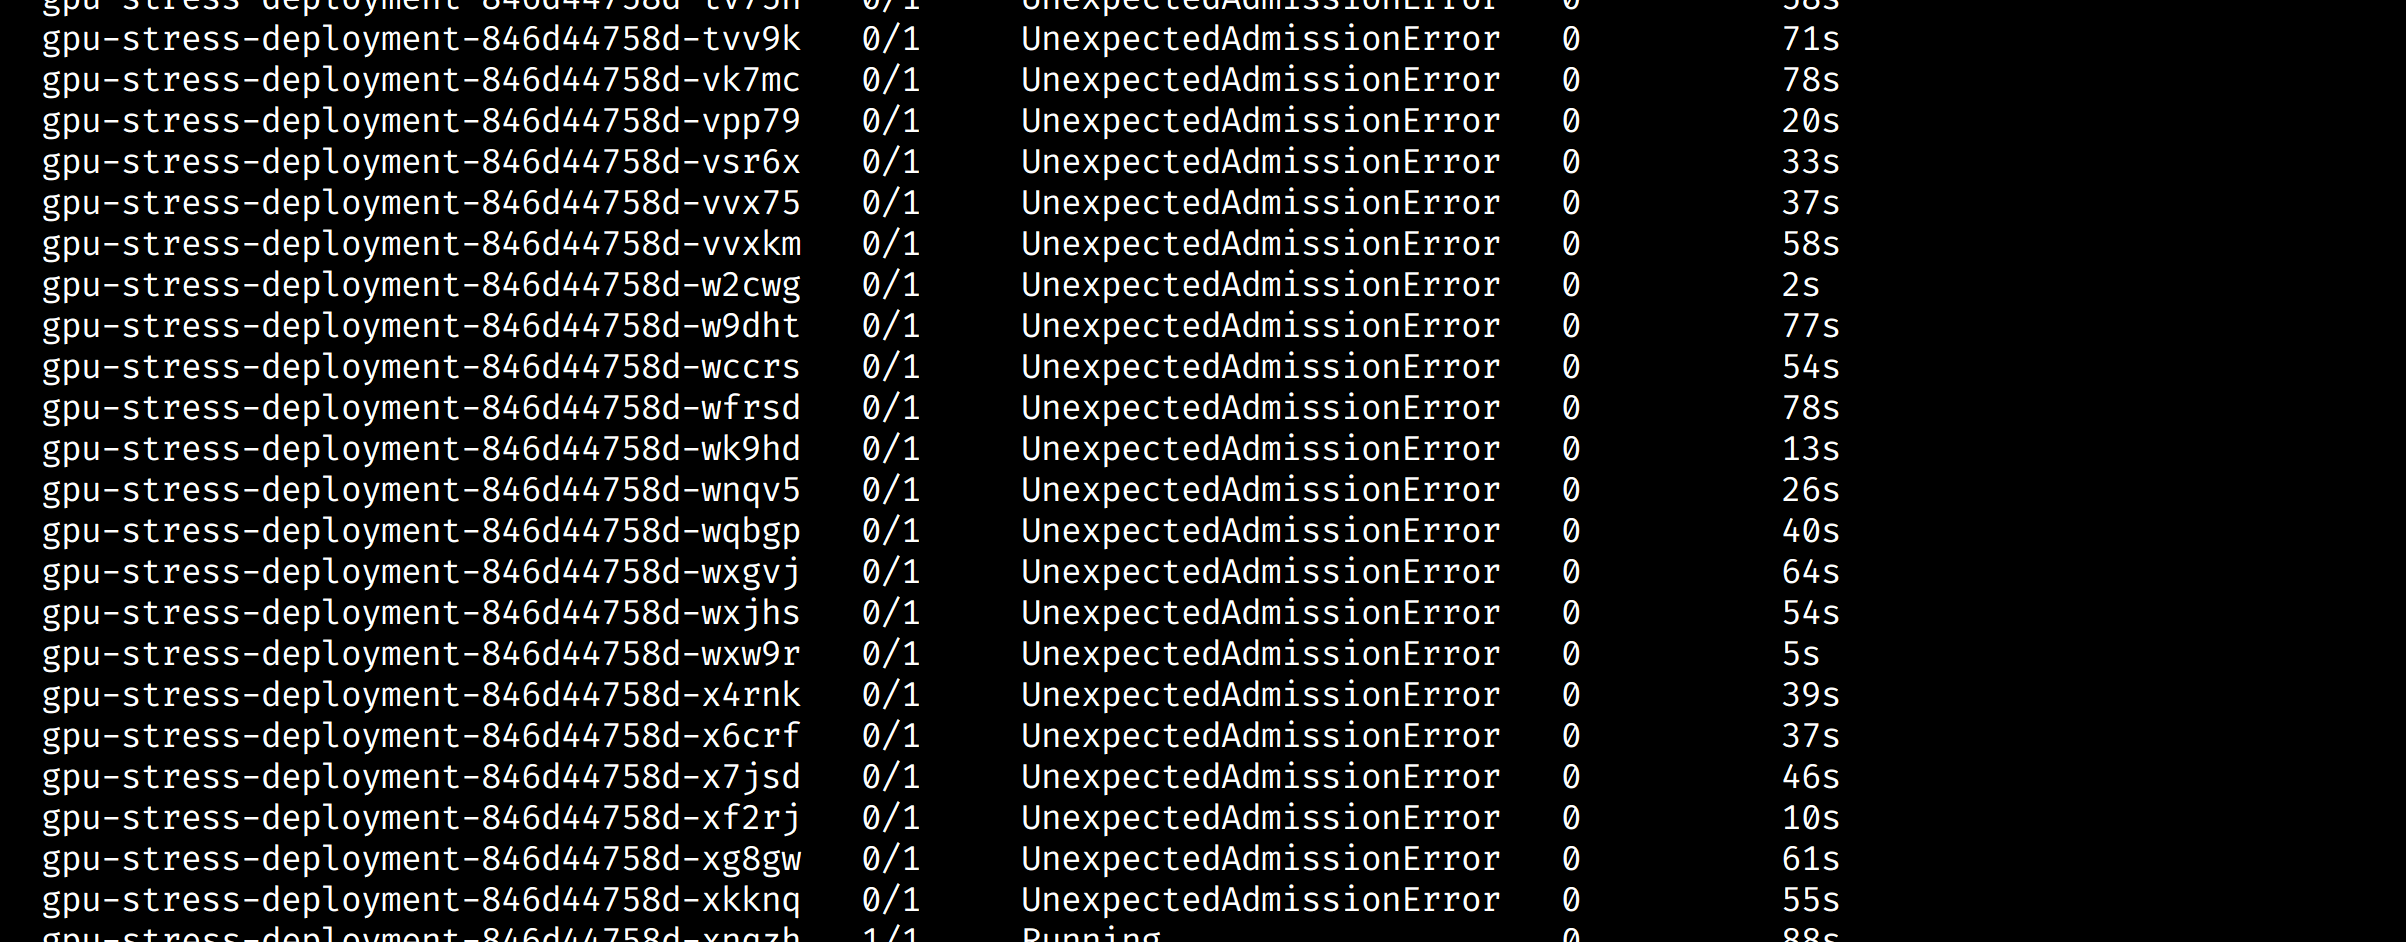
It might be that there’s some sort of GC that’ll kick in eventually to clean these pods up, but having pod count growing like this is bad/messy. I’ve not yet looked into how to manage this.
Secondly if I set 20 replicas to trigger a VRAM OOM scenario, we are back to the original problem. The last pods to startup will be the first ones to crash:
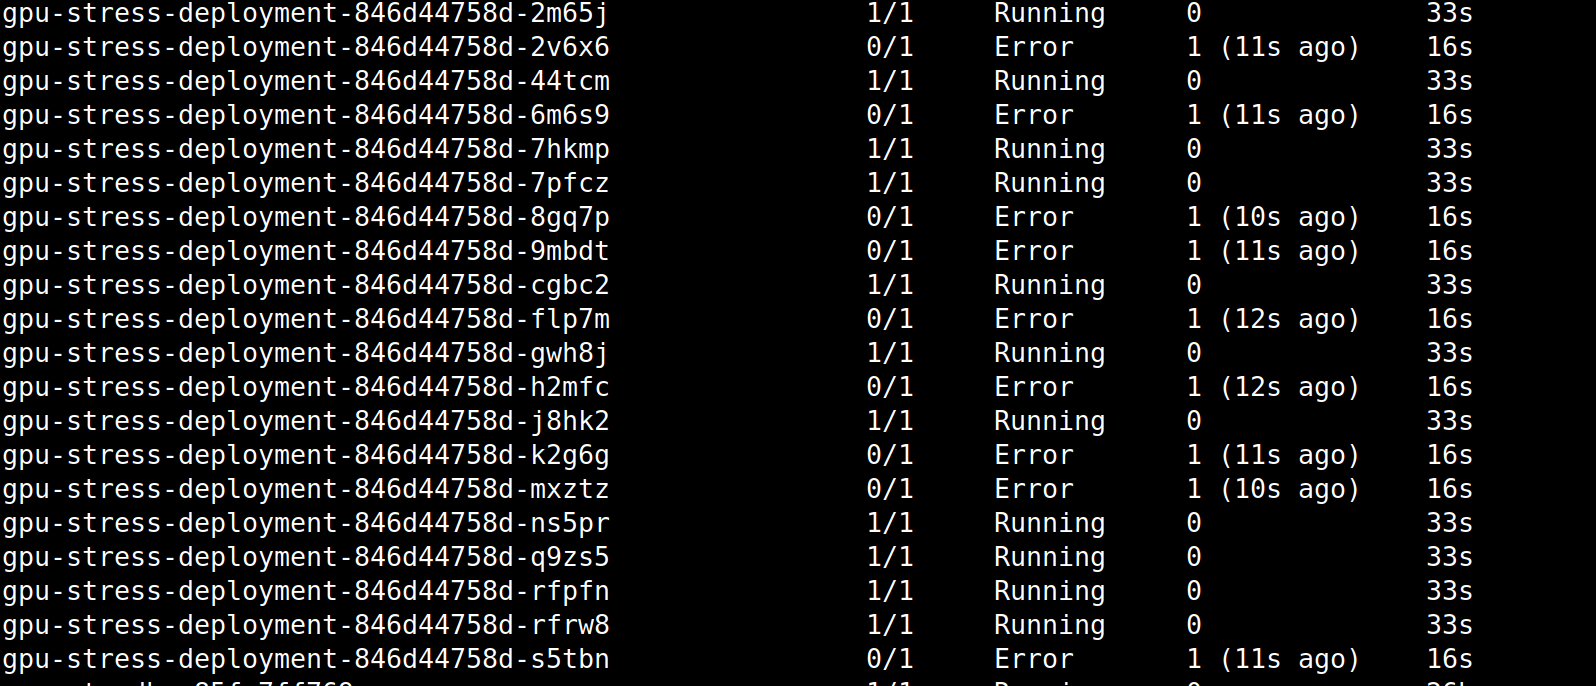
The error message is different, but the end result is the same:
torch.cuda.OutOfMemoryError: CUDA out of memory. Tried to allocate 256.00 MiB. GPU 0 has a total capacity of 44.52 GiB of which 211.25 MiB is free. Process 2692273 has 3.71 GiB memory in use. Process 2692511 has 3.71 GiB memory in use. Process 2692595 has 3.71 GiB memory in use. Process 2692860 has 3.71 GiB memory in use. Process 2692845 has 3.71 GiB memory in use. Process 2693028 has 3.71 GiB memory in use. Process 2693278 has 3.71 GiB memory in use. Process 2693304 has 3.71 GiB memory in use. Process 2693619 has 3.71 GiB memory in use. Process 2693652 has 3.71 GiB memory in use. Process 2693872 has 3.71 GiB memory in use. Process 2698618 has 2.73 GiB memory in use. Process 2700219 has 702.00 MiB memory in use. Of the allocated memory 269.46 MiB is allocated by PyTorch, and 8.54 MiB is reserved by PyTorch but unallocated. If reserved but unallocated memory is large try setting PYTORCH_CUDA_ALLOC_CONF=expandable_segments:True to avoid fragmentation. See documentation for Memory Management (https://pytorch.org/docs/stable/notes/cuda.html#environment-variables)
On the subject of memory, Nvidia’s docs do mention that time slicing is not memory tolerant:
Unlike Multi-Instance GPU (MIG), there is no memory or fault-isolation between replicas, but for some workloads this is better than not being able to share at all. Internally, GPU time-slicing is used to multiplex workloads from replicas of the same underlying GPU.
It’s unclear to me how to create a scenario where there’s a memory fault, and as a result I don’t know if I would personally ever run into this scenario. I’ve had to put investigating that avenue down.
We can see in this graph that with multiple replicas in play we’re getting dots as opposed to continuous lines. This is because time slicing is context switching between each cuda application i.e pod:

Therefore, one advantage of the slicing is that it does give better instrumentation via DCGM exporter than the default mechanism.
MIG
The next strategy to explain how to setup is Multi-instance GPUs (MIG). This allows us to partition a GPU up to seven times to create what I like to think of as mini self-contained GPUs. In k8s, that means we can have up to seven cuda applications i.e. pods talking to one GPU.
Now we can’t use this on an nvidia LS40:
https://docs.nvidia.com/datacenter/tesla/mig-user-guide/index.html#supported-gpus
But it does work on an A100.
As per Nvidia’s google doc
- a MIG cnsists of a single “GPU Instance” and a single “Compute Instance".
- Only a single MIG device should ever be requested by any given container in the system (If it needs more compute / memory than a device provides, request a bigger device)
- MIG devices will not be created dynamically anywhere within the K8s software stack.
Unlike time slicing, MIG is memory tolerant. Whatever that means.
Stategies
This term is about how MIG devices are exposed by Kubernetes onto a given node. As per Nvidia’s MIG document There are three (including the default) strategies:
- None - The none strategy is designed to keep the k8s-device-plugin running the same as it always has. It will make no distinction between GPUs that have MIG enabled on them or not, and will gladly enumerate all GPUs on the system and make them available over the nvidia.com/gpu resource type.
- Single - A Single type of GPU Per Node. This means you can have multiple GPUs, but they have to be the same card i.e. A100
- Mixed - GPUs on the Node may or may not have MIG enabled.
I’m going to focus on the Single strategy.
Enabling support
There are two areas to change. The helm chart and a driver update.
Firstly, we update our values.yaml config to this and do a helm upgrade on the device plugin chart:
config:
    default: 'default'
    map:
        default: |-
        a100: |-
            version: v1
            flags:
              migStrategy: "single"
Next, we have to enable MIG ourselves on the GPU worker node via nvidia-smi. Here are the commands to run on the GPU worker node:
nvidia-smi -mig 1 # 0 for disable, 1 for enable
You might see this warning:
00000000:CA:00.0 is currently being used by one or more other processes (e.g. CUDA application or a monitoring application such as another instance of nvidia-smi). Please first kill all processes using the device and retry the command or reboot the system to make MIG mode effective.
If you have no running processes showing up when the output of nvidia-smi is displayed, try doing modprobe -r nvidia_drm and running the mig enable command again. Alternatively, the simplest option is a reboot of the machine.
After MIG is enabled, we need to get all of the available profiles, so we use nvidia-smi again. For an A100 the output looks like this:
nvidia-smi mig -lgip
+-----------------------------------------------------------------------------+
| GPU instance profiles:                                                      |
| GPU   Name             ID    Instances   Memory     P2P    SM    DEC   ENC  |
|                              Free/Total   GiB              CE    JPEG  OFA  |
|=============================================================================|
|   0  MIG 1g.10gb       19     0/7        9.50       No     14     0     0   |
|                                                             1     0     0   |
+-----------------------------------------------------------------------------+
|   0  MIG 1g.10gb+me    20     0/1        9.50       No     14     1     0   |
|                                                             1     1     1   |
+-----------------------------------------------------------------------------+
|   0  MIG 1g.20gb       15     0/4        19.50      No     14     1     0   |
|                                                             1     0     0   |
+-----------------------------------------------------------------------------+
|   0  MIG 2g.20gb       14     0/3        19.50      No     28     1     0   |
|                                                             2     0     0   |
+-----------------------------------------------------------------------------+
|   0  MIG 3g.40gb        9     0/2        39.25      No     42     2     0   |
|                                                             3     0     0   |
+-----------------------------------------------------------------------------+
|   0  MIG 4g.40gb        5     0/1        39.25      No     56     2     0   |
|                                                             4     0     0   |
+-----------------------------------------------------------------------------+
|   0  MIG 7g.80gb        0     0/1        78.75      No     98     5     0   |
|                                                             7     1     1   |
+-----------------------------------------------------------------------------+
The instance profile names are a bit confusing. Let’s break it down. A 1g.10gb profile means 1 compute, 10GB of RAM. 4g.40gb means 4 combined computes for a total of 40GB of RAM. It’s worth calling out that you can only have certain combinations of profiles enabled at the same time. Further reading on the intracancies of GPU profiles can be found here. This screenshot shows the valid combinations for an a100 with 40GB of VRAM:

As mentioned previously, we can only partition up to seven times. Furthermore, we can’t create a 7g.80gb profile 7 times since we only have 80gb of VRAM. Therefore, we’ll keep things simple and create 7 MIG 1g.10gb profiles. Let’s use the profile ID to do so:
nvidia-smi mig -cgi 19,19,19,19,19,19,19
Next, we create the compute instances. As mentioned earlier, each gpu instance needs a compute instance to go with it.
root@<gpu_worker_node>:~# nvidia-smi mig -cci
Successfully created compute instance ID  0 on GPU  0 GPU instance ID  7 using profile MIG 1g.10gb (ID  0)
Successfully created compute instance ID  0 on GPU  0 GPU instance ID  8 using profile MIG 1g.10gb (ID  0)
Successfully created compute instance ID  0 on GPU  0 GPU instance ID  9 using profile MIG 1g.10gb (ID  0)
Successfully created compute instance ID  0 on GPU  0 GPU instance ID 10 using profile MIG 1g.10gb (ID  0)
Successfully created compute instance ID  0 on GPU  0 GPU instance ID 11 using profile MIG 1g.10gb (ID  0)
Successfully created compute instance ID  0 on GPU  0 GPU instance ID 12 using profile MIG 1g.10gb (ID  0)
Successfully created compute instance ID  0 on GPU  0 GPU instance ID 13 using profile MIG 1g.10gb (ID  0)
If the device plugin is in a crash loop due to this sort of error, restart it by deleting the pod:
I0612 14:52:38.021165 135 factory.go:104] Detected non-Tegra platform: /sys/devices/soc0/family file not found
E0612 14:52:38.340639 135 main.go:132] error starting plugins: error getting plugins: failed to construct NVML resource managers: error building device map: error building device map from config.resources: invalid MIG configuration: at least one device with migEnabled=true was not configured correctly: error visiting device: device 0 has an invalid MIG configuration
Let’s confirm it’s all working:
kubectl logs <nvidia-device-plugin-pod> -n <namespace> nvidia-device-plugin-ctr
Should produce this sort of output
Running with config:
{
  "version": "v1",
  "flags": {
    "migStrategy": "single", # Need this
    "failOnInitError": true,
    "mpsRoot": "/run/nvidia/mps",
    "nvidiaDriverRoot": "/",
    "gdsEnabled": false,
    "mofedEnabled": false,
    "useNodeFeatureAPI": null,
    "plugin": {
      "passDeviceSpecs": false,
      "deviceListStrategy": [
        "envvar"
      ],
      "deviceIDStrategy": "uuid",
      "cdiAnnotationPrefix": "cdi.k8s.io/",
      "nvidiaCTKPath": "/usr/bin/nvidia-ctk",
      "containerDriverRoot": "/driver-root"
    }
  },
  "resources": {
    "gpus": [
      {
        "pattern": "*",
        "name": "nvidia.com/gpu"
      }
    ],
    "mig": [  # Mig block is needed
      {
        "pattern": "*",
        "name": "nvidia.com/gpu"
      }
    ]
  },
  "sharing": {
    "timeSlicing": {}
  }
}
I0612 14:58:30.276172      39 main.go:279] Retrieving plugins.
I0612 14:58:30.277391      39 factory.go:104] Detected NVML platform: found NVML library
I0612 14:58:30.277493      39 factory.go:104] Detected non-Tegra platform: /sys/devices/soc0/family file not found
I0612 14:58:30.996609      39 server.go:216] Starting GRPC server for 'nvidia.com/gpu'
I0612 14:58:30.997581      39 server.go:147] Starting to serve 'nvidia.com/gpu' on /var/lib/kubelet/device-plugins/nvidia-gpu.sock
I0612 14:58:31.003147      39 server.go:154] Registered device plugin for 'nvidia.com/gpu' with Kubelet
And a describe on your gpu node should produce this output (notice the 7 replicas):
Capacity:
    cpu: 48
    ephemeral-storage: 458761416Ki
    hugepages-1Gi: 0
    hugepages-2Mi: 0
    memory: 131433532Ki
    nvidia.com/gpu: 7 # -----------
    pods: 110
Allocatable:
    cpu: 48
    ephemeral-storage: 422794520286
    hugepages-1Gi: 0
    hugepages-2Mi: 0
    memory: 131331132Ki
    nvidia.com/gpu: 7 # --------------
    pods: 110
Furthemore, the node labels will have been updated to match the profile we’re using:
kubectl get node <gpu_worker_node> --output=json | jq '.metadata.labels' | grep -E "mig|gpu.memory|gpu.count|gpu.product" | sort
  "nvidia.com/gpu.count": "7",
  "nvidia.com/gpu.memory": "9728",
  "nvidia.com/gpu.product": "NVIDIA-A100-80GB-PCIe-MIG-1g.10gb",
  "nvidia.com/mig.capable": "true",
  "nvidia.com/mig.strategy": "single",
Let’s update our test deployment manifest to pin it to the a100 GPU:
apiVersion: apps/v1
kind: Deployment
metadata:
    name: gpu-stress-deployment
spec:
    strategy:
        type: Recreate
    replicas: 7 # Max replicas for MIG
    selector:
        matchLabels:
            app: gpu-stress
    template:
        metadata:
            annotations:
                logging.findmypast.com/enable: 'true'
            labels:
                app: gpu-stress
        spec:
            nodeName: <a100_gpu_worker_node_name>
            nodeSelector:
                nvidia.com/gpu: 'true'
            tolerations:
                - key: 'nvidia.com/gpu'
                  operator: 'Exists'
                  effect: 'NoSchedule'
            terminationGracePeriodSeconds: 0
            containers:
                - name: gpu-stress-test
                  image: <gpu_stress_image>
                  command:
                      - /bin/sh
                      - -c
                      - |
                          while true; do
                            GPU_INFO=$(nvidia-smi -L | grep 'MIG' | awk '{print $6}')
                            echo "Pod Name: $(hostname) $GPU_INFO"
                            sleep 1
                          done
                  imagePullPolicy: Always
                  resources:
                      limits:
                          nvidia.com/gpu: 1
We can see that each pod has its own MIG instance:
kubectl logs -l app=gpu-stress | uniq
Produces:
Pod Name: gpu-stress-deployment-559f78879f-dq6ph MIG-28f9cfba-f647-5fbd-9ffc-289d76ab68c3)
Pod Name: gpu-stress-deployment-559f78879f-qn4sn MIG-6cc76831-29b0-5096-8f46-1857aa03020d)
Pod Name: gpu-stress-deployment-559f78879f-4bzcw MIG-3de06ce0-345d-59d2-a456-07bb2b96c99f)
Pod Name: gpu-stress-deployment-559f78879f-4qtf7 MIG-3ffa6d81-e907-5163-829c-7137caee9619)
Pod Name: gpu-stress-deployment-559f78879f-58ktk MIG-e5fa528f-7a43-560b-a7e2-7514efe57318)
Pod Name: gpu-stress-deployment-559f78879f-9dzmk MIG-7f075782-5e27-50ec-a749-1041c0343f1b)
Pod Name: gpu-stress-deployment-559f78879f-bxqs2 MIG-30e63f44-35c2-530d-9437-2c49853eae09)
And if we run our python snippet by exec’ing into a pod running a cuda application we can see that the memory and processor count have been updated:
import torch
torch.cuda.get_device_properties(torch.device('cuda'))
# _CudaDeviceProperties(name='NVIDIA A100 80GB PCIe MIG 1g.10gb', major=8, minor=0, total_memory=9728MB, multi_processor_count=14)
The MIG graph looks like this. Notce that, unlike time slicing, each pod is a continuous line. I’ve set grafana to stack each time series to avoid all of them overlapping.
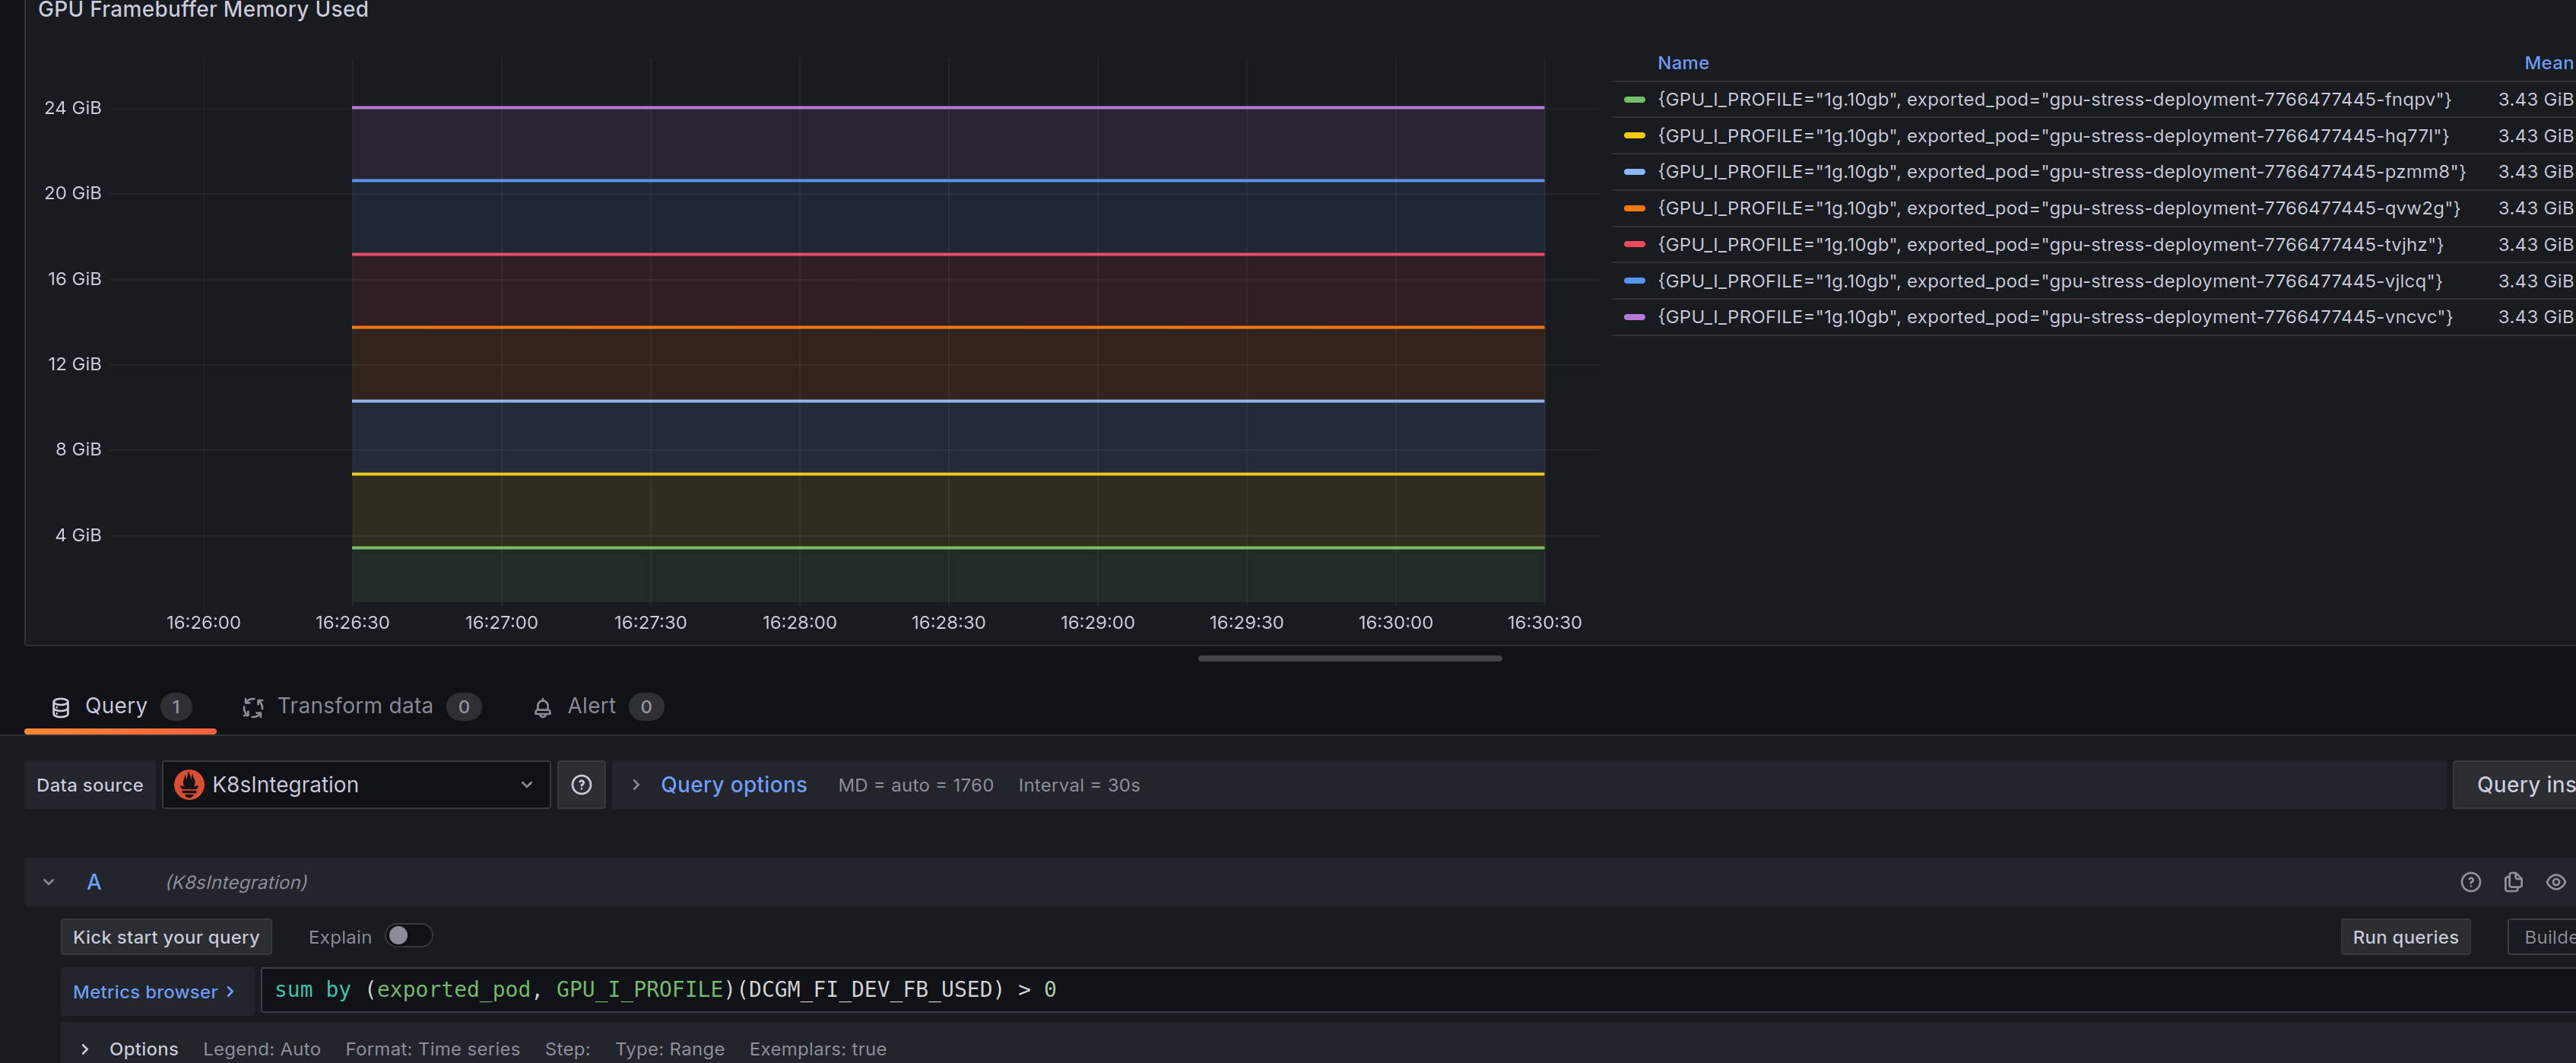
A downside with MIG with this profile configuration is that the A100 GPU used for this post has an 80GB framebuffer. But 10GB+ is unaccounted for. I couldn’t find an explanation for this on Nvidia’s docs, but according to RedHat the eight instance is reserved for allowing MIG to work. That will have to stay a mystery.
MPS
Multi-Process Service (MPS) is available, but at the time of writing it’s still experimental.
Here’s a high level diagram of this works:
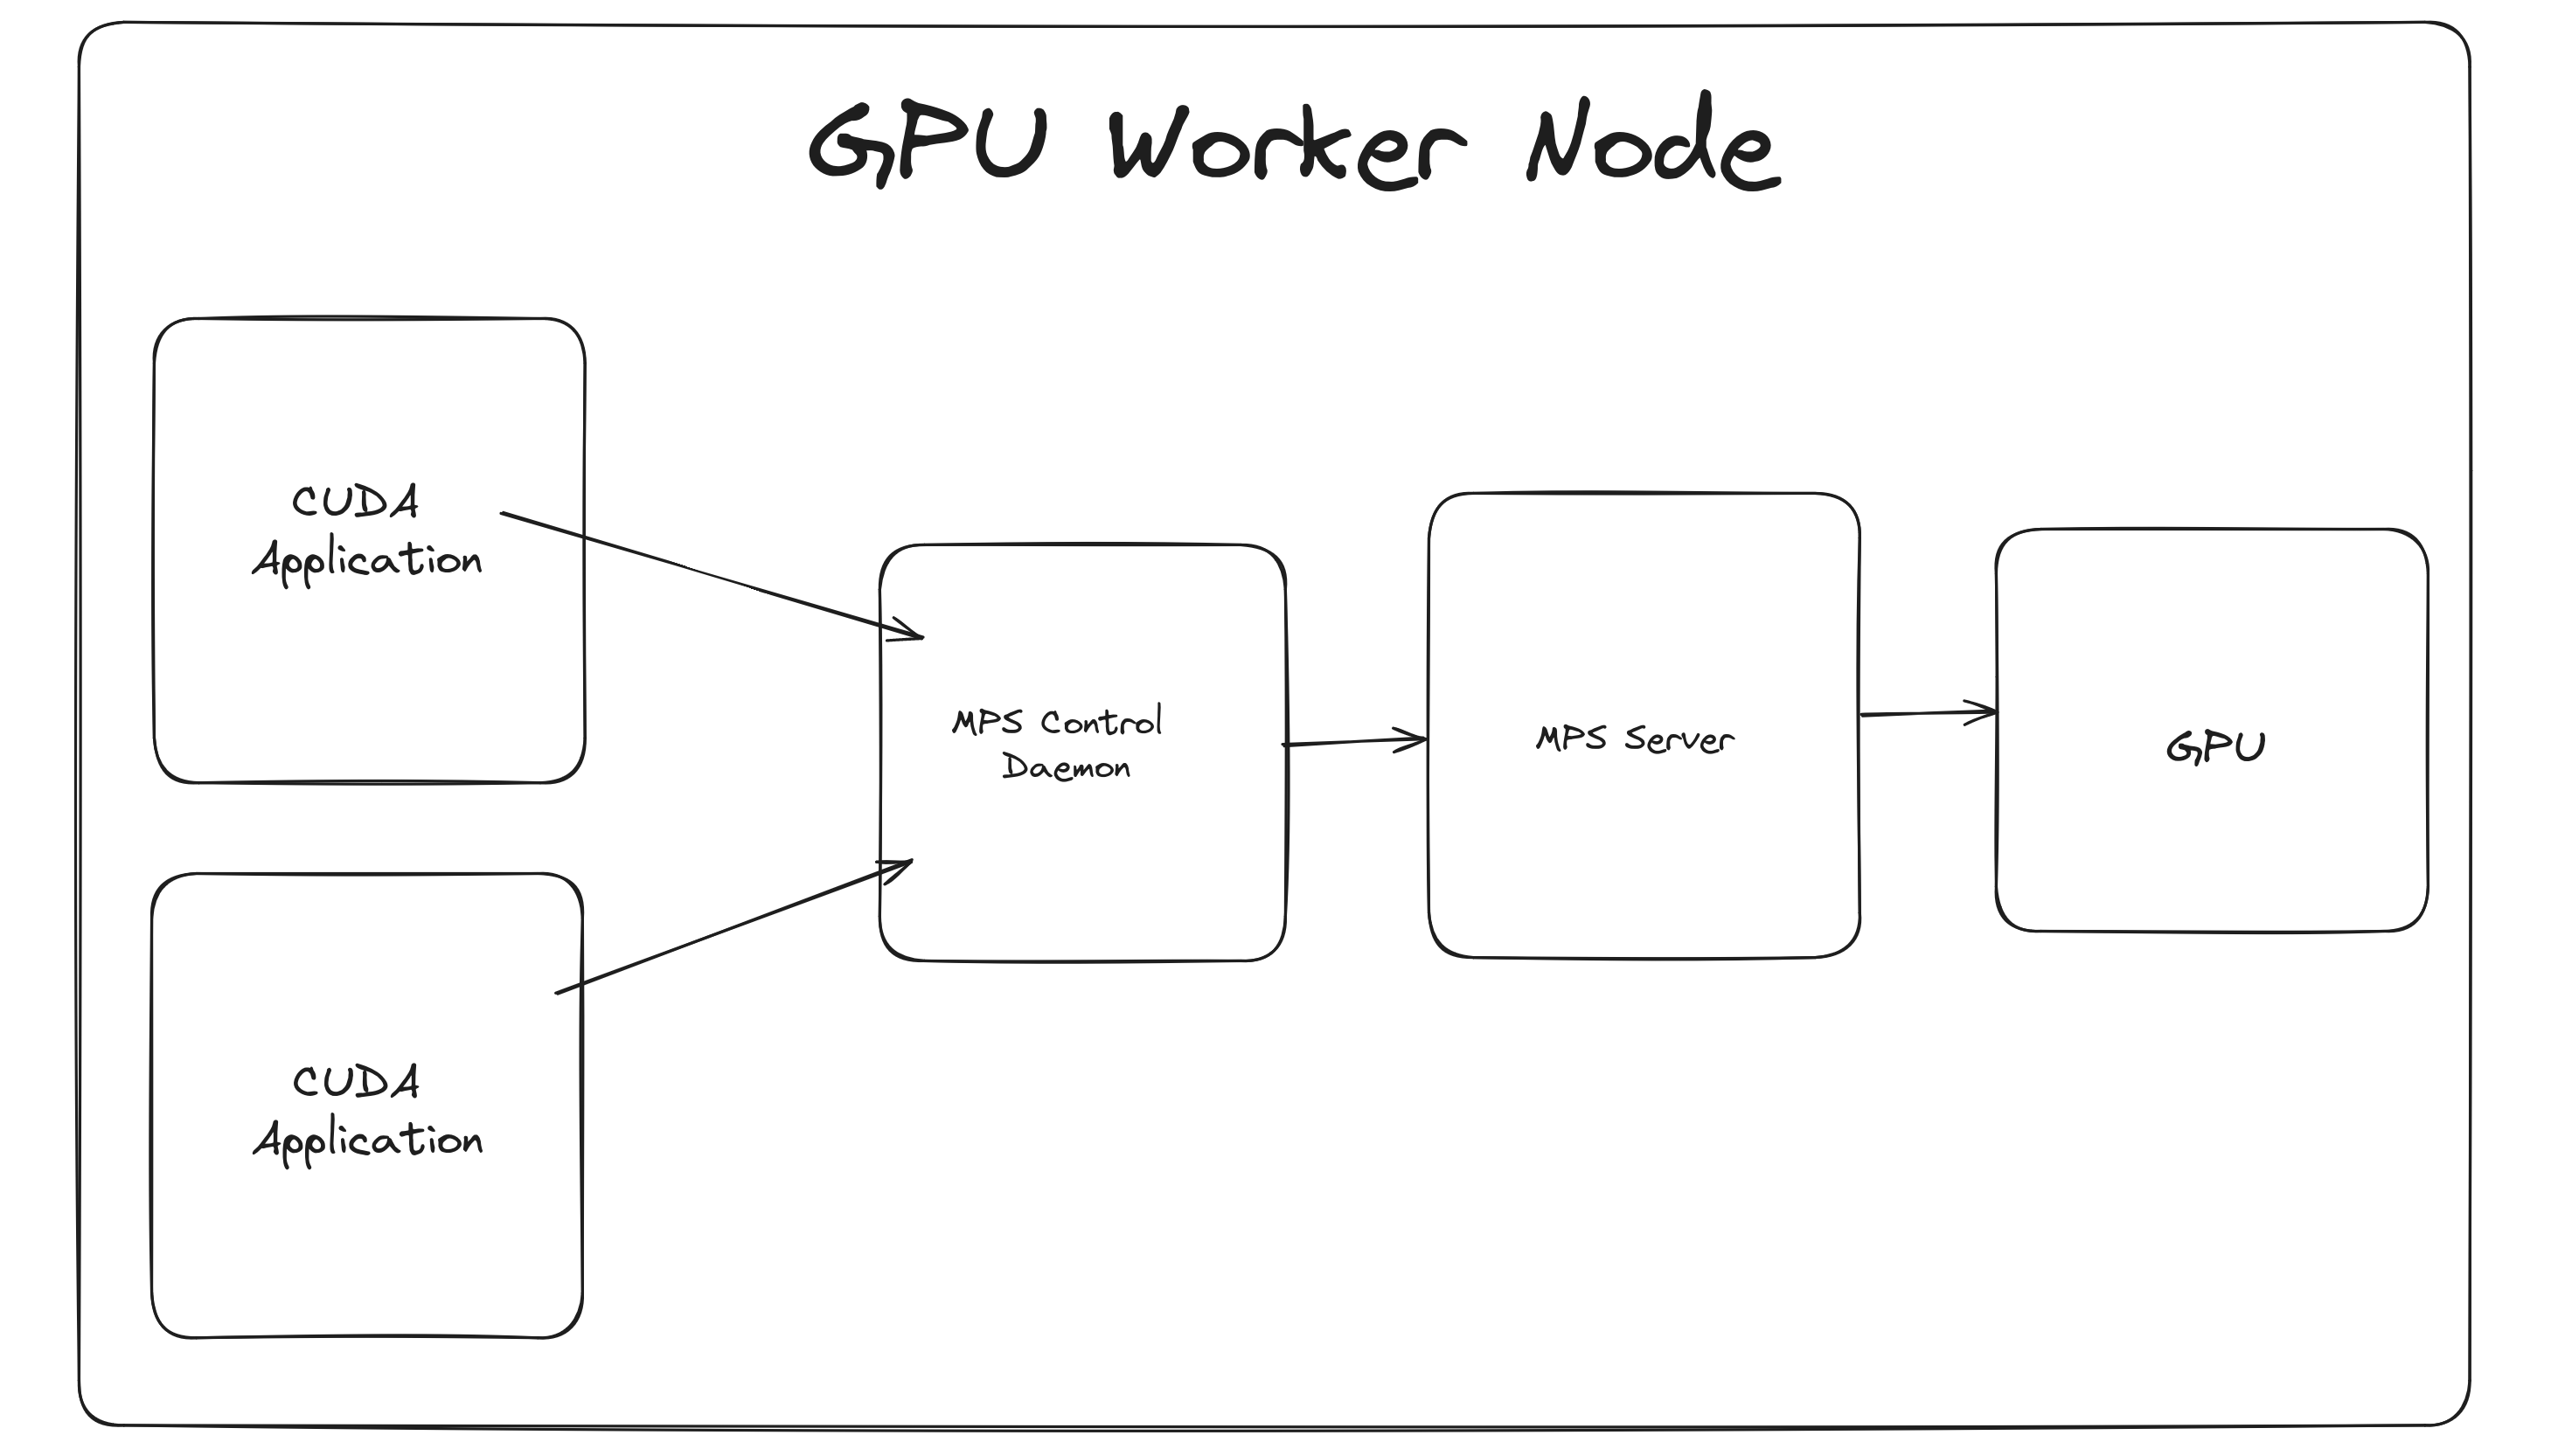
And the gist of how each component works:
- Control Daemon Process – This starts/stops the server and coordinates connections between clients and servers. For this to work, the daemon sets the compute mode to
EXCLUSIVE_PROCESS. Therefore, there’s only one server available that can talk to the GPU. - Client Runtime – This is a CUDA Driver library that’s available on the cuda application pod.
- Server Process – The server is the clients’ shared connection to the GPU and provides concurrency between clients.
The benefits of MPS are:
A single process may not utilize all the compute and memory-bandwidth capacity available on the GPU. MPS allows kernel and memcopy operations from different processes to overlap on the GPU, > achieving higher utilization and shorter running times.
Without MPS, each CUDA processes using a GPU allocates separate storage and scheduling resources on the GPU. In contrast, the MPS server allocates one copy of GPU storage and scheduling resources shared by all its clients.
Without MPS, when processes share the GPU their scheduling resources must be swapped on and off the GPU. The MPS server shares one set of scheduling resources between all of its clients, eliminating the overhead of swapping when the GPU is scheduling between those clients.
Therefore:
- We can enforce memory limits on processes that are allocated a given quota of GPU.
- We have less context switching.
However, unlike MIG, MPS is not memory tolerant.
It’s worth calling out how the client runtime connects to the server. If you start a cuda application in k8s, it talks to the daemon via an env var that is a path to a socket:
root@gpu-stress-deployment-5857c45556-fx6xs:/run# printenv | grep CUDA
CUDA_MPS_PIPE_DIRECTORY=/mps/nvidia.com/gpu/pipe
This then interacts with the server. So in a pod using an MPS capable GPU node, you can do this:
echo get_default_active_thread_percentage | nvidia-cuda-mps-control
# 10.0 (10% due to 10 GPU replicas)
To confirm that connecting to the MPS server is successful
Configuration
As with time slicing, we define a config map to be used by the nvidia helm chart:
config:
    default: 'default'
    map:
        default: |-
        ls40: |-
            version: v1
            sharing:
              mps:
                resources:
                  - name: nvidia.com/gpu
                    replicas: 10
This will cause the helm chart to spin up the mps control daemonset. This requires a certain label to be set to true for this to work:
The way to get this label to go true is via the node feature discovery daemonset. It adds additional labels the worker node to let the device plugin know that we can use MPS.
kubectl get node <gpu_worker_node>   --output=json | jq '.metadata.labels' | grep -E "mps|SHARED|replicas" | sort

"nvidia.com/gpu.product": "NVIDIA-L40S-SHARED",
"nvidia.com/gpu.replicas": "10",
"nvidia.com/gpu.sharing-strategy": "mps",
"nvidia.com/mps.capable": "true"
It’s supposed to be that the helm chart will setup the mps daemon on each GPU node with an mps daemon pod. However, this didn’t work for me at first. It took me hours to figure out that a reboot of the each machine after enabling MPS would allow the daemon pods to start. This doesn’t seem right to me, as they make no mention of this requirement in their docs, so I’ve opened an issue on Nvidia’s GitHub page.
DCGM metrics exporter instruments something that looks like time slicing:

Running our python snippet to get the GPU information via cuda we can see the following:
import torch
torch.cuda.get_device_properties(torch.device("cuda"))
# _CudaDeviceProperties(name='NVIDIA L40S', major=8, minor=9, total_memory=45589MB, multi_processor_count=14)
Note that the multi_processor_count has dropped to 14 from 142. This is because MPS does floor(multi_processor_count / replicas)
Annoyingly the value returned from total_memory is misleading. You’d think it would drop to 4GB i.e. floor(total_memory / replicas) sort of thing. However, it reports the total memory available on the hardware, not the framebuffer that’s allocated to the pod. I spent several hours scratching my head trying to figure this out. I’ve raised a separate issue to understand this problem better.
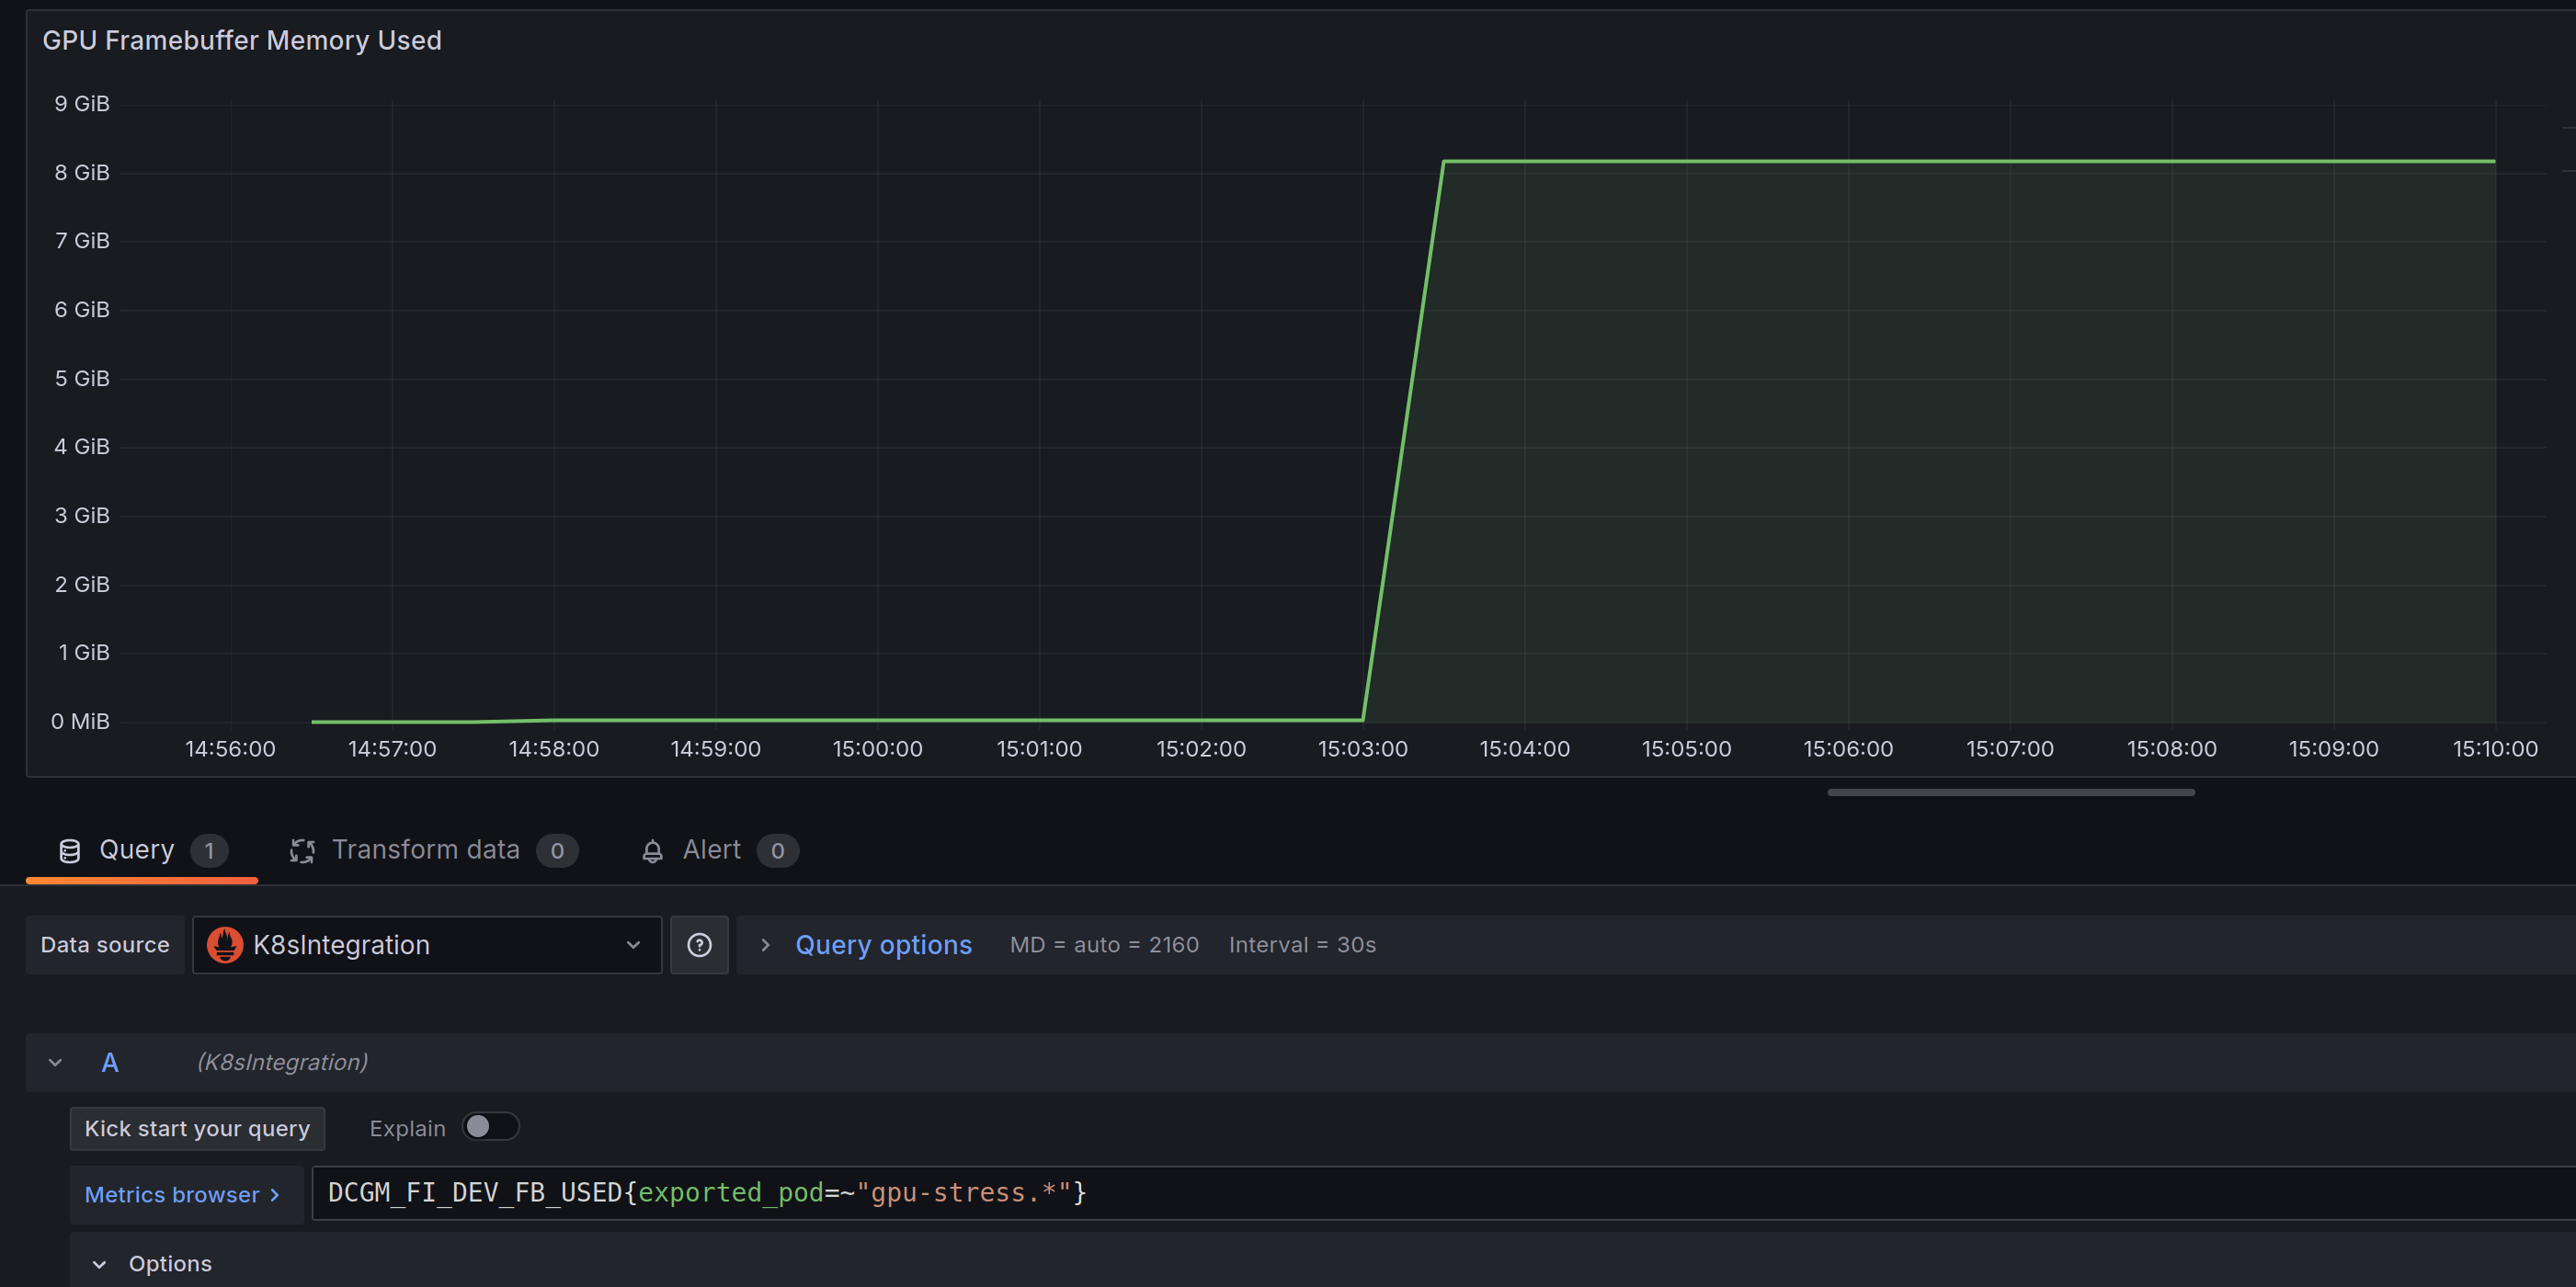
Nonetheless, I can see it works. My dummy application works if I set the deployment to only have 5 replicas:
But will crash if I set it back to 10 replicas due to the available VRAM dropping to 4GB:
Current time: 19886 days, 14:14:15.317649Time taken for one iteration: 0.994462 seconds
Traceback (most recent call last):
  File "/app/tensor_stress.py", line 34, in <module>
    tensor_core_stress_test()
  File "/app/tensor_stress.py", line 28, in tensor_core_stress_test
    torch.cuda.synchronize()
  File "/opt/conda/lib/python3.10/site-packages/torch/cuda/__init__.py", line 801, in synchronize
    return torch._C._cuda_synchronize()
RuntimeError: CUDA error: the remote procedural call between the MPS server and the MPS client failed
CUDA kernel errors might be asynchronously reported at some other API call, so the stacktrace below might be incorrect.
For debugging consider passing CUDA_LAUNCH_BLOCKING=1.
Compile with `TORCH_USE_CUDA_DSA` to enable device-side assertions.```
And if we try to re-run it:
root@gpu-stress-deployment-5857c45556-j9gqs:/app# python tensor_stress.py
Traceback (most recent call last):
  File "/app/tensor_stress.py", line 34, in <module>
    tensor_core_stress_test()
  File "/app/tensor_stress.py", line 25, in tensor_core_stress_test
    C = torch.matmul(A, B)
torch.cuda.OutOfMemoryError: CUDA out of memory. Tried to allocate 2.00 GiB. GPU 0 has a total capacity of 44.52 GiB of which 448.96 MiB is free. Process 220085 has 28.06 MiB memory in use. Process 220083 has 4.06 GiB memory in use. Of the allocated memory 4.00 GiB is allocated by PyTorch, and 0 bytes is reserved by PyTorch but unallocated. If reserved but unallocated memory is large try setting PYTORCH_CUDA_ALLOC_CONF=expandable_segments:True to avoid fragmentation.  See documentation for Memory Management  (https://pytorch.org/docs/stable/notes/cuda.html#environment-variables)
Selecting Multiple
To specify multiple strategies, we configure multiple config maps.
config:
    default: 'default'
    map:
        default: |- # default cm
        ls40: |-
            version: v1
            sharing:
              timeSlicing:
                resources:
                  - name: nvidia.com/gpu
                    replicas: 6
        a100: |-
            version: v1
            sharing:
              mps:
                resources:
                  - name: nvidia.com/gpu
                    replicas: 10
Let’s describe an nvidia device plugin pod (any will do):
# nvidia-device-plugin pod environment variables
Environment:
NODE_NAME: (v1:spec.nodeName)
NODE_LABEL: nvidia.com/device-plugin.config
CONFIG_FILE_SRCDIR: /available-configs
CONFIG_FILE_DST: /config/config.yaml
DEFAULT_CONFIG: default
FALLBACK_STRATEGIES: named,single
SEND_SIGNAL: true
SIGNAL: 1
PROCESS_TO_SIGNAL: nvidia-device-plugin
The NODE_LABEL env var is important here. It’s what the device plugin uses for deciding which config map within the config.map object to select.
I’ve just left the default value of nvidia.com/device-plugin.config as the node label name.
For values, if we do this:
kubectl label node <gpu_worker_node_a100> nvidia.com/device-plugin.config=a100 --overwrite
kubectl label node <gpu_worker_node_ls40> nvidia.com/device-plugin.config=ls40 --overwrite
We can then have two different types of GPU sharing strategies running. So instead of having two mps control daemon pods, we now have one:
nvidia-dcgm-exporter-crjx7
nvidia-device-plugin-4qwj2
nvidia-device-plugin-cwjtx
nvidia-device-plugin-gpu-feature-discovery-jqzzl
nvidia-device-plugin-gpu-feature-discovery-xzfhk
nvidia-device-plugin-mps-control-daemon-pm7m5 # for the ls40 gpu
nvidia-device-plugin-node-feature-discovery-master-8475b9bd8k8j
nvidia-device-plugin-node-feature-discovery-worker-mr2vf
nvidia-device-plugin-node-feature-discovery-worker-mzllx
And by reviewing the output of a describe on each node we can also see it’s working:
kubectl get node <gpu_worker_node>   --output=json | jq '.metadata.labels' | grep -E "mps|SHARED|replicas" | sort

  "nvidia.com/gpu.product": "NVIDIA-L40S-SHARED",
  "nvidia.com/gpu.replicas": "6",
  "nvidia.com/mps.capable": "false"

kubectl get node <gpu_worker_node>   --output=json | jq '.metadata.labels' | grep -E "mps|SHARED|replicas" | sort

  "nvidia.com/gpu.product": "NVIDIA-A100-80GB-PCIe-SHARED",
  "nvidia.com/gpu.replicas": "10",
  "nvidia.com/gpu.sharing-strategy": "mps",
  "nvidia.com/mps.capable": "true"
What’s next
I’ll be benchmarking all three strategies to see what performance gains there are. I’ll do another writeup for the results.